Select Page

MyEyedro User Guide v5

  1. Introduction
    1. Account Access
    2. Signing In
    3. Signing Out
    4. Help & Support
    5. MyEyedro Mobile
  2. Plugins
    1. Highlights
    2. Demand - Live
      1. Temperature Overlay
      2. Demand Alerts
        1. Demand Threshold Average
        2. Demand Threshold Continuous
        3. Demand Threshold Instantaneous
    3. Consumption
      1. Consumption Alerts
        1. Consumption Threshold
    4. Bills
    5. Reports
    6. Net Meter
    7. Compare
    8. Utility Dashboard
    9. Meter
    10. Asset Intelligence
  3. Tools
    1. Data Exporter
    2. Base Load
    3. Peak Load
    4. Unit Converter
    5. Cost Estimator
    6. Solar Calculator
  4. Configuration
    1. User Configuration
      1. Opening User Configuration
      2. Change Password
    2. Site Configuration
      1. Opening Site Configuration
      2. Add Site
      3. Edit Site
      4. Delete Site
      5. Share Site
        1. Un-Share Site
    3. Rate Configuration
      1. Opening Rate Configuration
      2. Bill Profiles
        1. Add Bill Profile
        2. Edit Bill Profile
        3. Delete Bill Profile
      3. Rate Profiles
        1. Add Rate Profile
        2. Edit Rate Profile
        3. Delete Rate Profile
        4. Fixed Price
        5. Tiered
        6. Time of Use
        7. Daily Tiered
        8. Tiered Time of Use
        9. Other Fees
    4. Device Configuration
      1. Opening Device Configuration
      2. Add Device
      3. Edit Device Settings
        1. Gateway Module
        2. Electricity Module
        3. Pulse Module
        4. Temperature Module
      4. Delete Device
      5. Updating Device Firmware
      6. Active/Inactive Alerts
    5. Display Group Configuration
      1. Opening Display Group Configuration
      2. Add Display Group
      3. Edit Display Group
      4. Delete Display Group
      5. Share Display Group
        1. Un-Share Display Group
      6. Configure Alerts
    6. Report Configuration
      1. Opening Report Configuration
      2. Add Report Profile
      3. Edit Report Profile
      4. Delete Report Profile
      5. Report Types
        1. Net Meter
        2. Usage and Cost
        3. Usage and Cost with Graph
        4. Usage Ranking (Premium)
        5. Renewable Generation Metrics (Premium)
        6. Renewable Generation Ranking (Premium)
        7. Asset Metrics (Pro)
        8. Asset Ranking (Pro)
        9. Device Settings (Pro)
        10. Device Uptime (Pro)
        11. New Users (Branded Site Admin)
        12. User Metrics (Branded Site Admin)
      6. Scheduled Reports
    7. Alert Configuration
      1. Opening Alert Configuration
      2. Edit Alert Options
    8. Asset Configuration
      1. Opening Asset Configuration
      2. Asset Profiles
        1. Add Asset Profile
        2. Edit Asset Profile
        3. Delete Asset Profile
      3. Assets
        1. Add Asset
        2. Edit Asset
        3. Delete Asset
  5. Integrated SmartApps

2.1.Highlights #

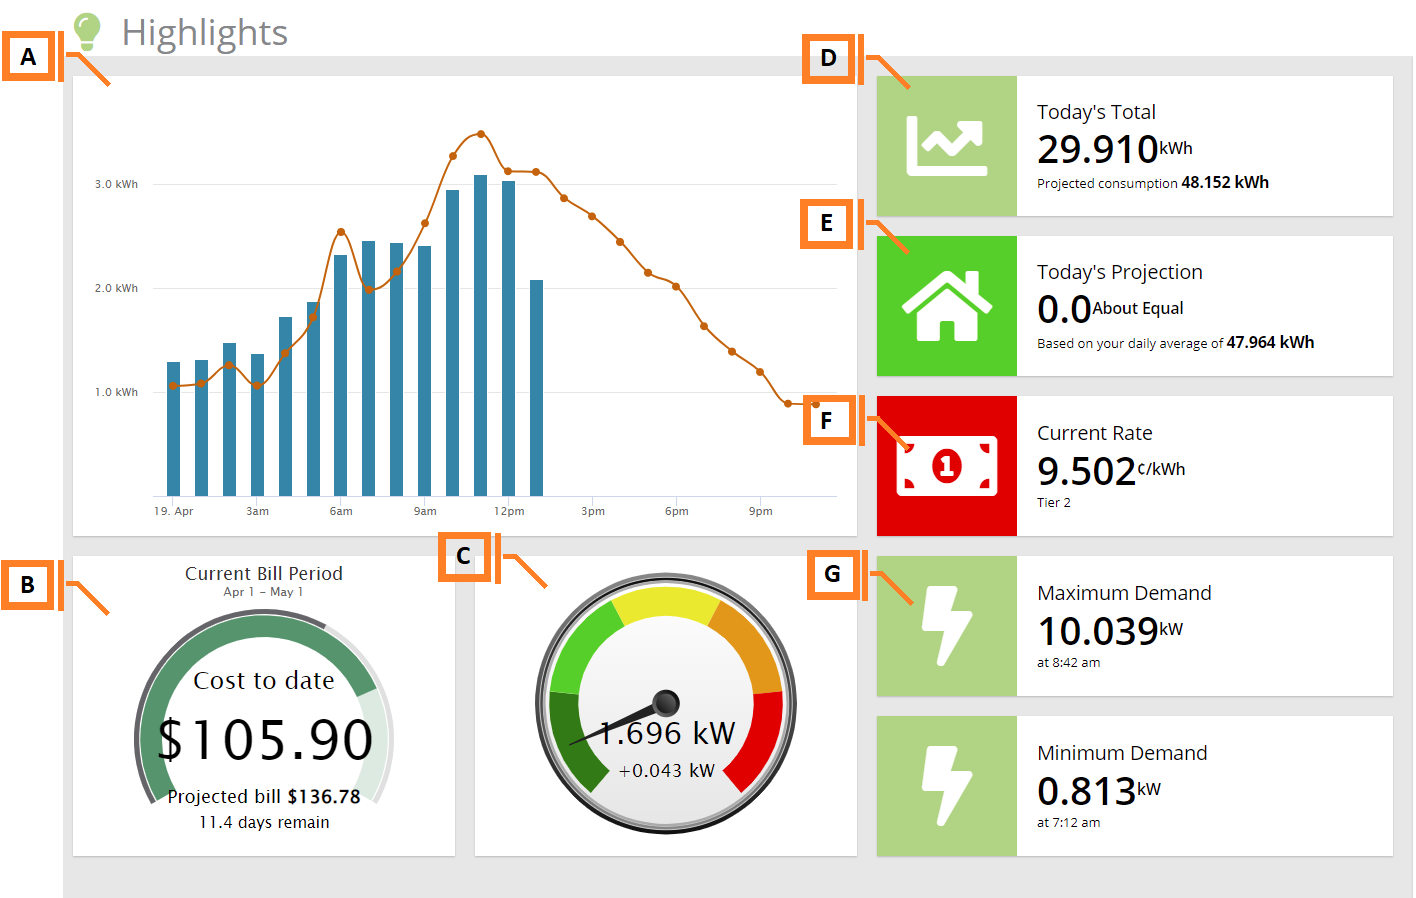
The Highlights plugin displays convenient at-a-glance summaries of electrical consumption and estimated costs for all sensors of a specified Display Group.


 FieldHow It’s Used

A

Hourly GraphThe hourly cost/consumption for all sensors. Hovering your mouse over the orange line graph shows a rolling 4 week average for comparison purposes.

B

Billing SummaryDisplays billing summary data, including:

  • Bill to Date: estimated total electricity cost to date.
  • Bill Estimate: estimated total electricity cost.

C

Current Demand GaugeThe total electrical demand at the current time, as the demand goes up, the dial will rotate around the gauge so you can see at a glance if your demand is where you expect it.

D

Today’s TotalThe total consumption so far, along with a projected amount for how much consumption there will be at the current pace.

E

Today’s ProjectionThe projected cost/consumption of your electricity for today.

F

Current RateThe current price you are being charged per kilowatt hour (kWh), based on currently active Rate Structure.

G

Current Demand SummaryThe minimum and maximum electricity demand measured today since midnight.

NOTE: If displaying data as cost, the demand is multiplied by the current billing rate to determine instantaneous cost.


Additional Display Options

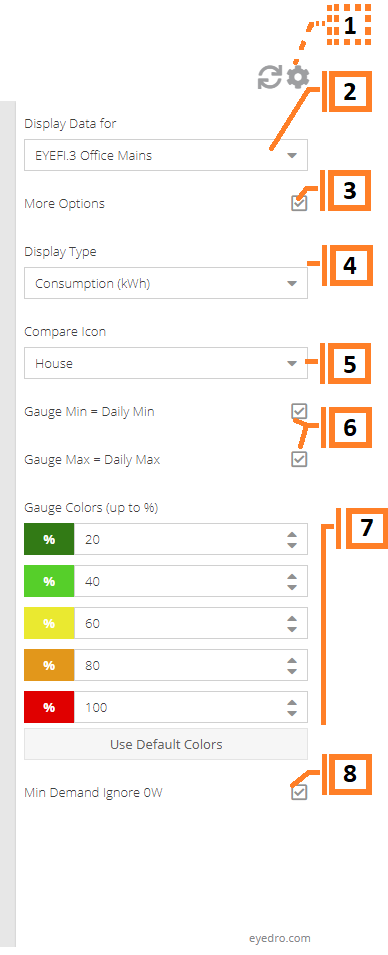
Numbered image of the additional options for the highlights plugin.


  1. Optional if you do not see this panel on the right side of the screen, you will have to click this grey cog to expand it, and the refresh button beside it will refresh the plugin.
  2. Specify which Display Group data should be displayed for by selecting the appropriate Display Group from the “Display data for” dropdown menu.
  3. Click on the More Options menu to customize your plugin settings.
  4. Specify whether the Highlights plugin should display Cost ($) information or Consumption (kWh) information.
  5. Specify which graphic should be used for projection (ex. House, Car).
  6. Specify whether the Current Demand Summary gauge should use the current day’s Daily Max Demand as its maximum value. If unchecked, you can specify a custom maximum value (in watts) for the gauge.
  7. Customize the colours used in the Current Demand Summary By default, colours on the gauge represent demand from 0W (green) to the maximum value (red) in 20% increments.
  8. Tells the plugin to ignore the minimum demand if it isn’t higher than 0.


Mobile View

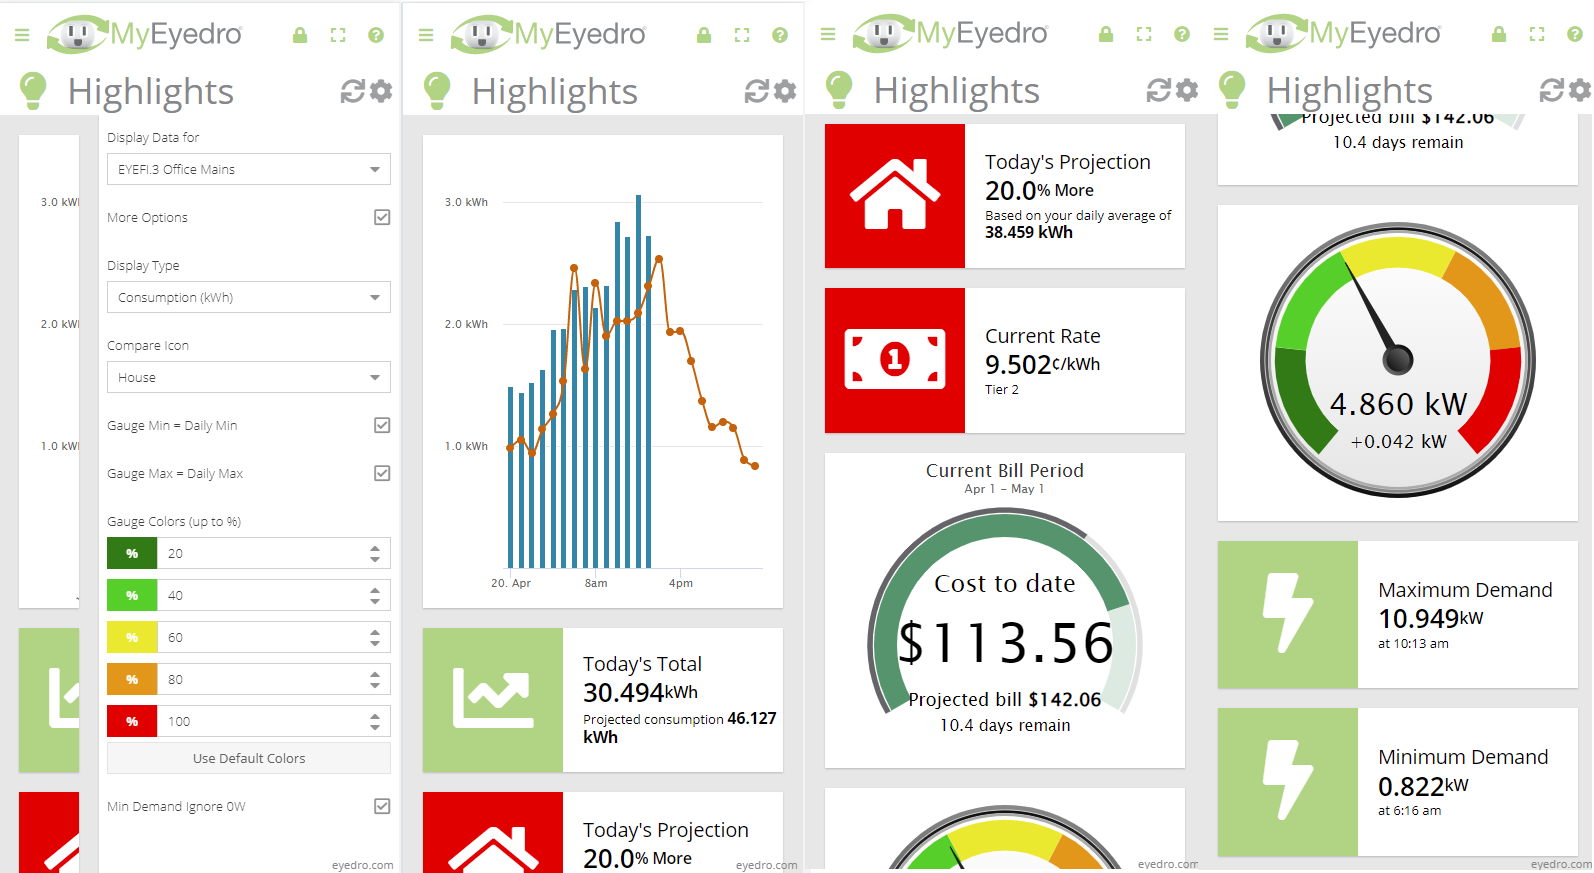
Mobile view of the highlights plugin example.

Yes No
6 of 6 users found this section helpful
Suggest Edit