
Highlights | MyEyedro User Guide
The MyEyedro Highlights plugin displays convenient at-a-glance summaries of electrical consumption and estimated costs for a selected Display Group. The Highlights view provides:
- Real-Time Usage at a Glance: Instantly visualize your current electrical demand with an intuitive, rotating gauge that shows you exactly where you stand.
- Smart Budget Forecasting: Take the guesswork out of utilities with live bill estimates and daily projections that track your spending to the cent.
- Data-Driven Comparisons: Analyze hourly consumption trends across multiple meters and benchmark your performance
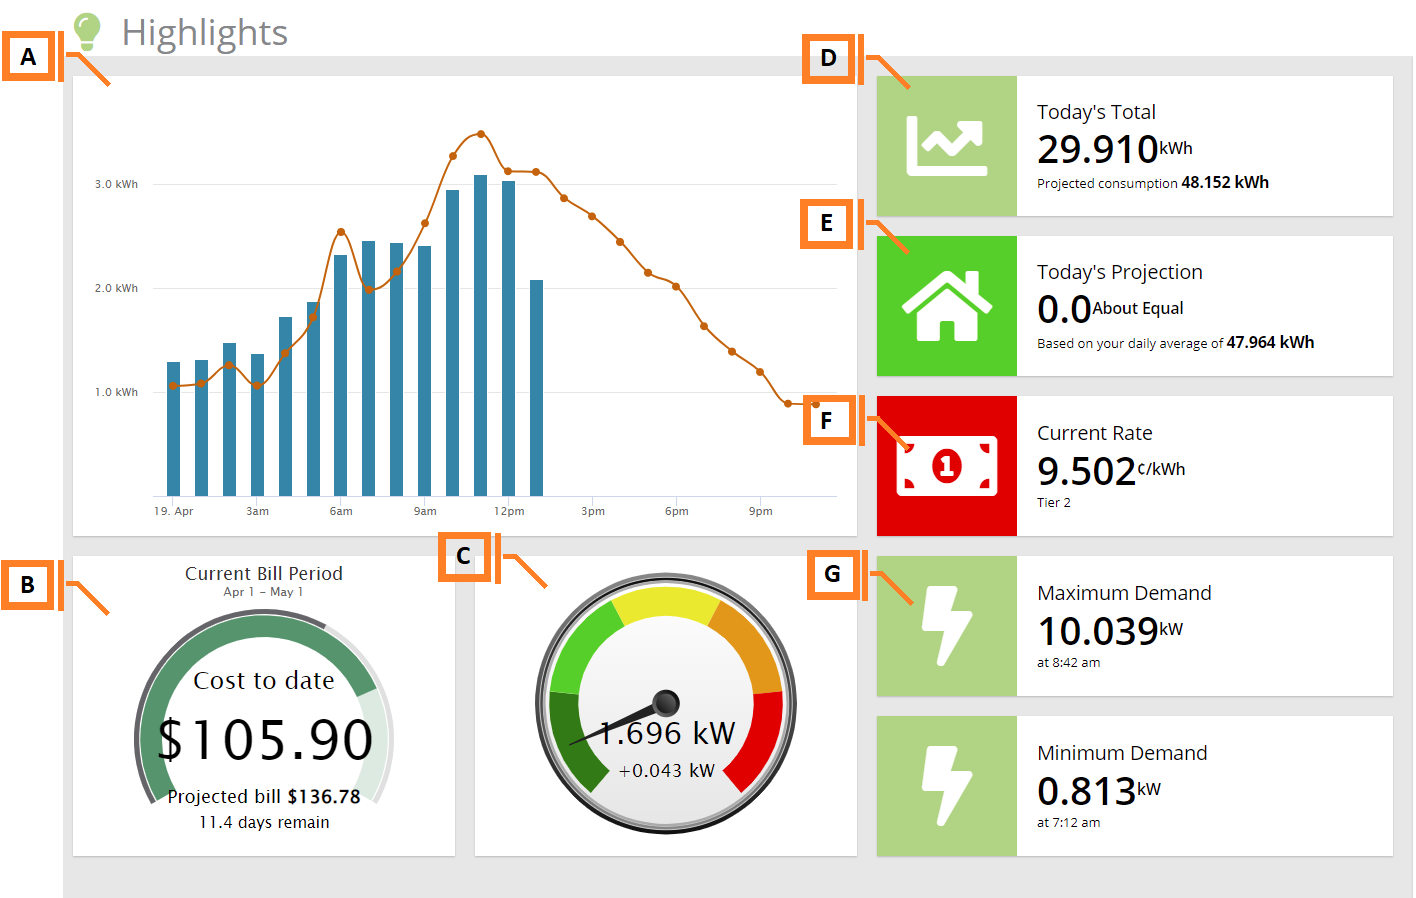
- Hourly Graph. The hourly cost/consumption for all sensors. Hovering your mouse over the orange line graph shows a rolling 4 week average for comparison purposes.
- Billing Summary. Displays billing summary data, including:
- Bill to Date: estimated total electricity cost to date.
- Bill Estimate: estimated total electricity cost.
- Current Demand. The total electrical demand at the current time, as the demand goes up, the dial will rotate around the gauge so you can see at a glance if your demand is where you expect it.
- Today’s Total. The total consumption so far, along with a projected amount for how much consumption there will be at the current pace.
- Today’s Projection. The projected cost/consumption of your electricity for today.
- Current Rate. The current price you are being charged per kilowatt hour (kWh), based on the Rate Structure of the selected Display Group.
- Demand Highlights. The minimum and maximum electricity demand measured today since midnight. NOTE: If displaying data as cost, the demand is multiplied by the current billing rate to determine instantaneous cost.
Highlights Plugin Tools and Options

- Plugin Tools:
- Refresh. Update the data and visuals on screen.
- Options. Expand or collapse the options menu.
- Select which Display Group to evaluate. NOTE: Only display groups comprised of electricity, gas or water monitoring devices are available in this plugin.
- Check the More Options checkbox to show additional options.
- Specify whether the Highlights plugin should display Cost ($) information or Consumption (kWh) information.
- Specify which graphic is used for Today’s Projection (ex. House, Car).
- Specify whether the Current Demand gauge should use the measured minimum and maximum values from the current date. If unchecked, you can specify custom values (in watts) for the gauge.
- Customize the colour bands used by the Current Demand gauge. By default, colours on the gauge represent demand from 0% (green) to 100% (red) in 20% increments.
- Check to ignore wattage readings of 0 when determining minimum demand.
Mobile Screenshots
