
Utility Dashboard | MyEyedro User Guide
The MyEyedro Utility Dashboard plugin displays at a glance demand and consumption data for up to 3 display groups allowing you to keep track of multiple display groups with varying utility types (such as electricity, water, and gas for a building). Alternatively this plugin can be used as a simple side-by-side comparison of various installations. The Utility Dashboard provides:
- Multi-Utility Command Center: Monitor up to three distinct utility types—including electricity, water, and gas—within a single, unified Utility Dashboard for a total view of your building’s footprint.
- High-Impact Visual Tracking: Combine historical trends with live data using Integrated Demand Gauges and hourly graphs that show you exactly how your consumption is shifting in real time.
- Side-by-Side Site Comparisons: Effortlessly benchmark different installations or utility regions with customizable headers and color-coded regions, making it simple to spot efficiencies across your entire portfolio.
The Utility Dashboard plugin is available to users with a MyEyedro Professional license. To add a MyEyedro Professional license to your account and assign it to a device, please read the article here. This feature is also enabled for user accounts with one(+) Eyedro for Business products or five(+) Home Energy Monitor products.
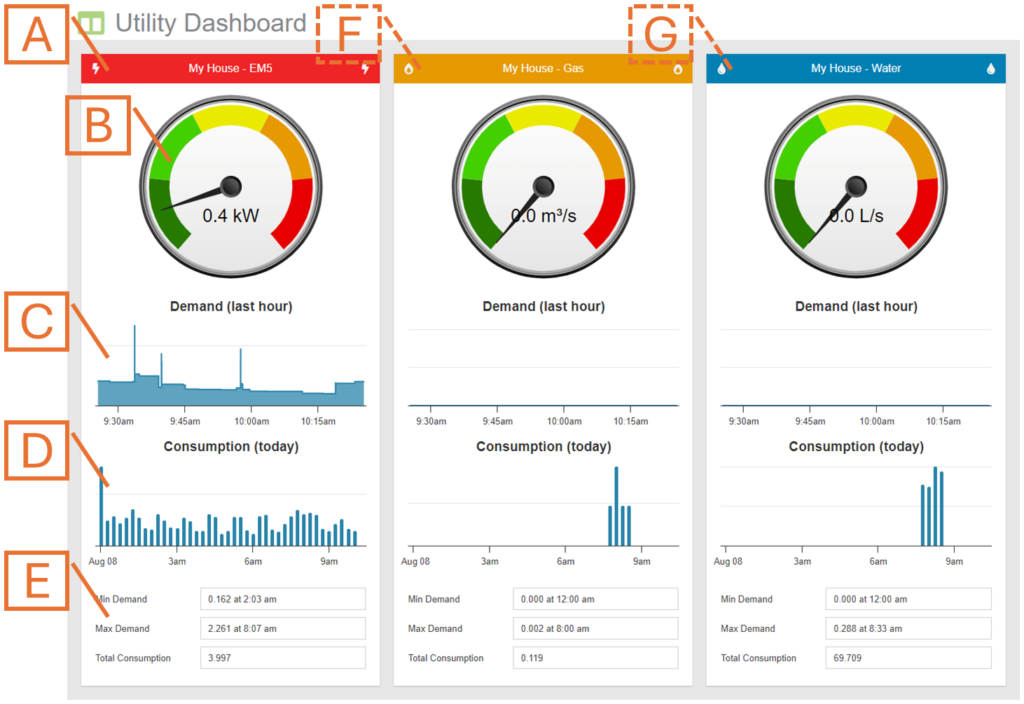
- Utility Region. Displays data for the Display Group selected as Utility 1 in the options. NOTE: header label, icon and colour come from the Display Group configuration.
- Demand Gauge. Displays the current demand.
- Demand Graph. Displays the demand over the past hour.
- Consumption Graph. Displays the consumption over the past day.
- Statistics. Additional measurement metrics for demand and consumption.
- Second Utility Region. Optionally show data for a second “Utility”.
- Third Utility Region. Optionally show data for a third “Utility”
Utility Dashboard Plugin Tools and Options
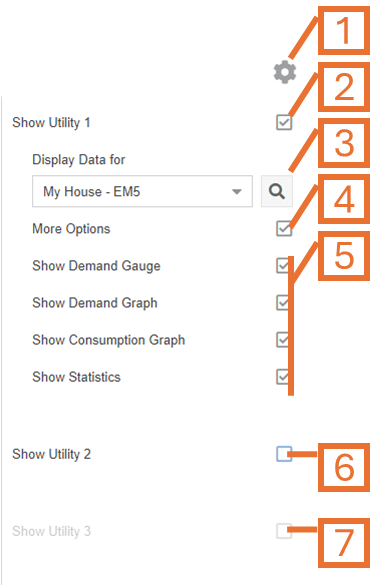
- Plugin Tools:
- Options. Expand or collapse the options menu.
- Check to show Utility 1 Region.
- Select which Display Group to evaluate as Utility 1.
- Check the More Options checkbox to show additional options.
- Additional options can be used to show or hide the various components displayed in the Utility Region.
- Optionally, check to show Utility 2 Region. Uncheck to hide.
- Optionally, check to show Utility 3 Region. Uncheck to hide.