
Asset Intelligence | MyEyedro User Guide
The MyEyedro Asset Intelligence plugin provides detailed run-state analysis for monitoring machinery and lab equipment. This plugin is intended to be used for analysis of multiple pieces of equipment (assets) that share the same type of properties and expected operation (asset properties) – i.e. monitor a dozen milling machines from Acme Corp. The Asset Intelligence view provide:
- Enterprise-Scale Asset Intelligence: Gain deep, run-state analysis for an entire fleet of machinery or lab equipment, allowing you to monitor and compare dozens of assets with shared operational profiles in one unified view.
- Precision Independent Monitoring: Track every piece of equipment with surgical accuracy by utilizing isolated branch circuit monitoring or inline machine sensors to capture the unique performance data of every individual asset.
- Visual Run-State Analytics: Gain total transparency into equipment behavior with a 24-Hour Run-State Graph that overlays electrical demand with customizable performance thresholds to identify peak efficiency.
It is assumed that each “asset” is being independently monitored either by installing Eyedro Electricity Monitors on their isolated branch circuit(s) or using Eyedro Machine Monitoring products inline with the individual pieces of equipment.
The Asset Intelligence plugin is only available to users with a MyEyedro Professional license. To add a MyEyedro Professional license to your account and assign it to a device, please read the article here.
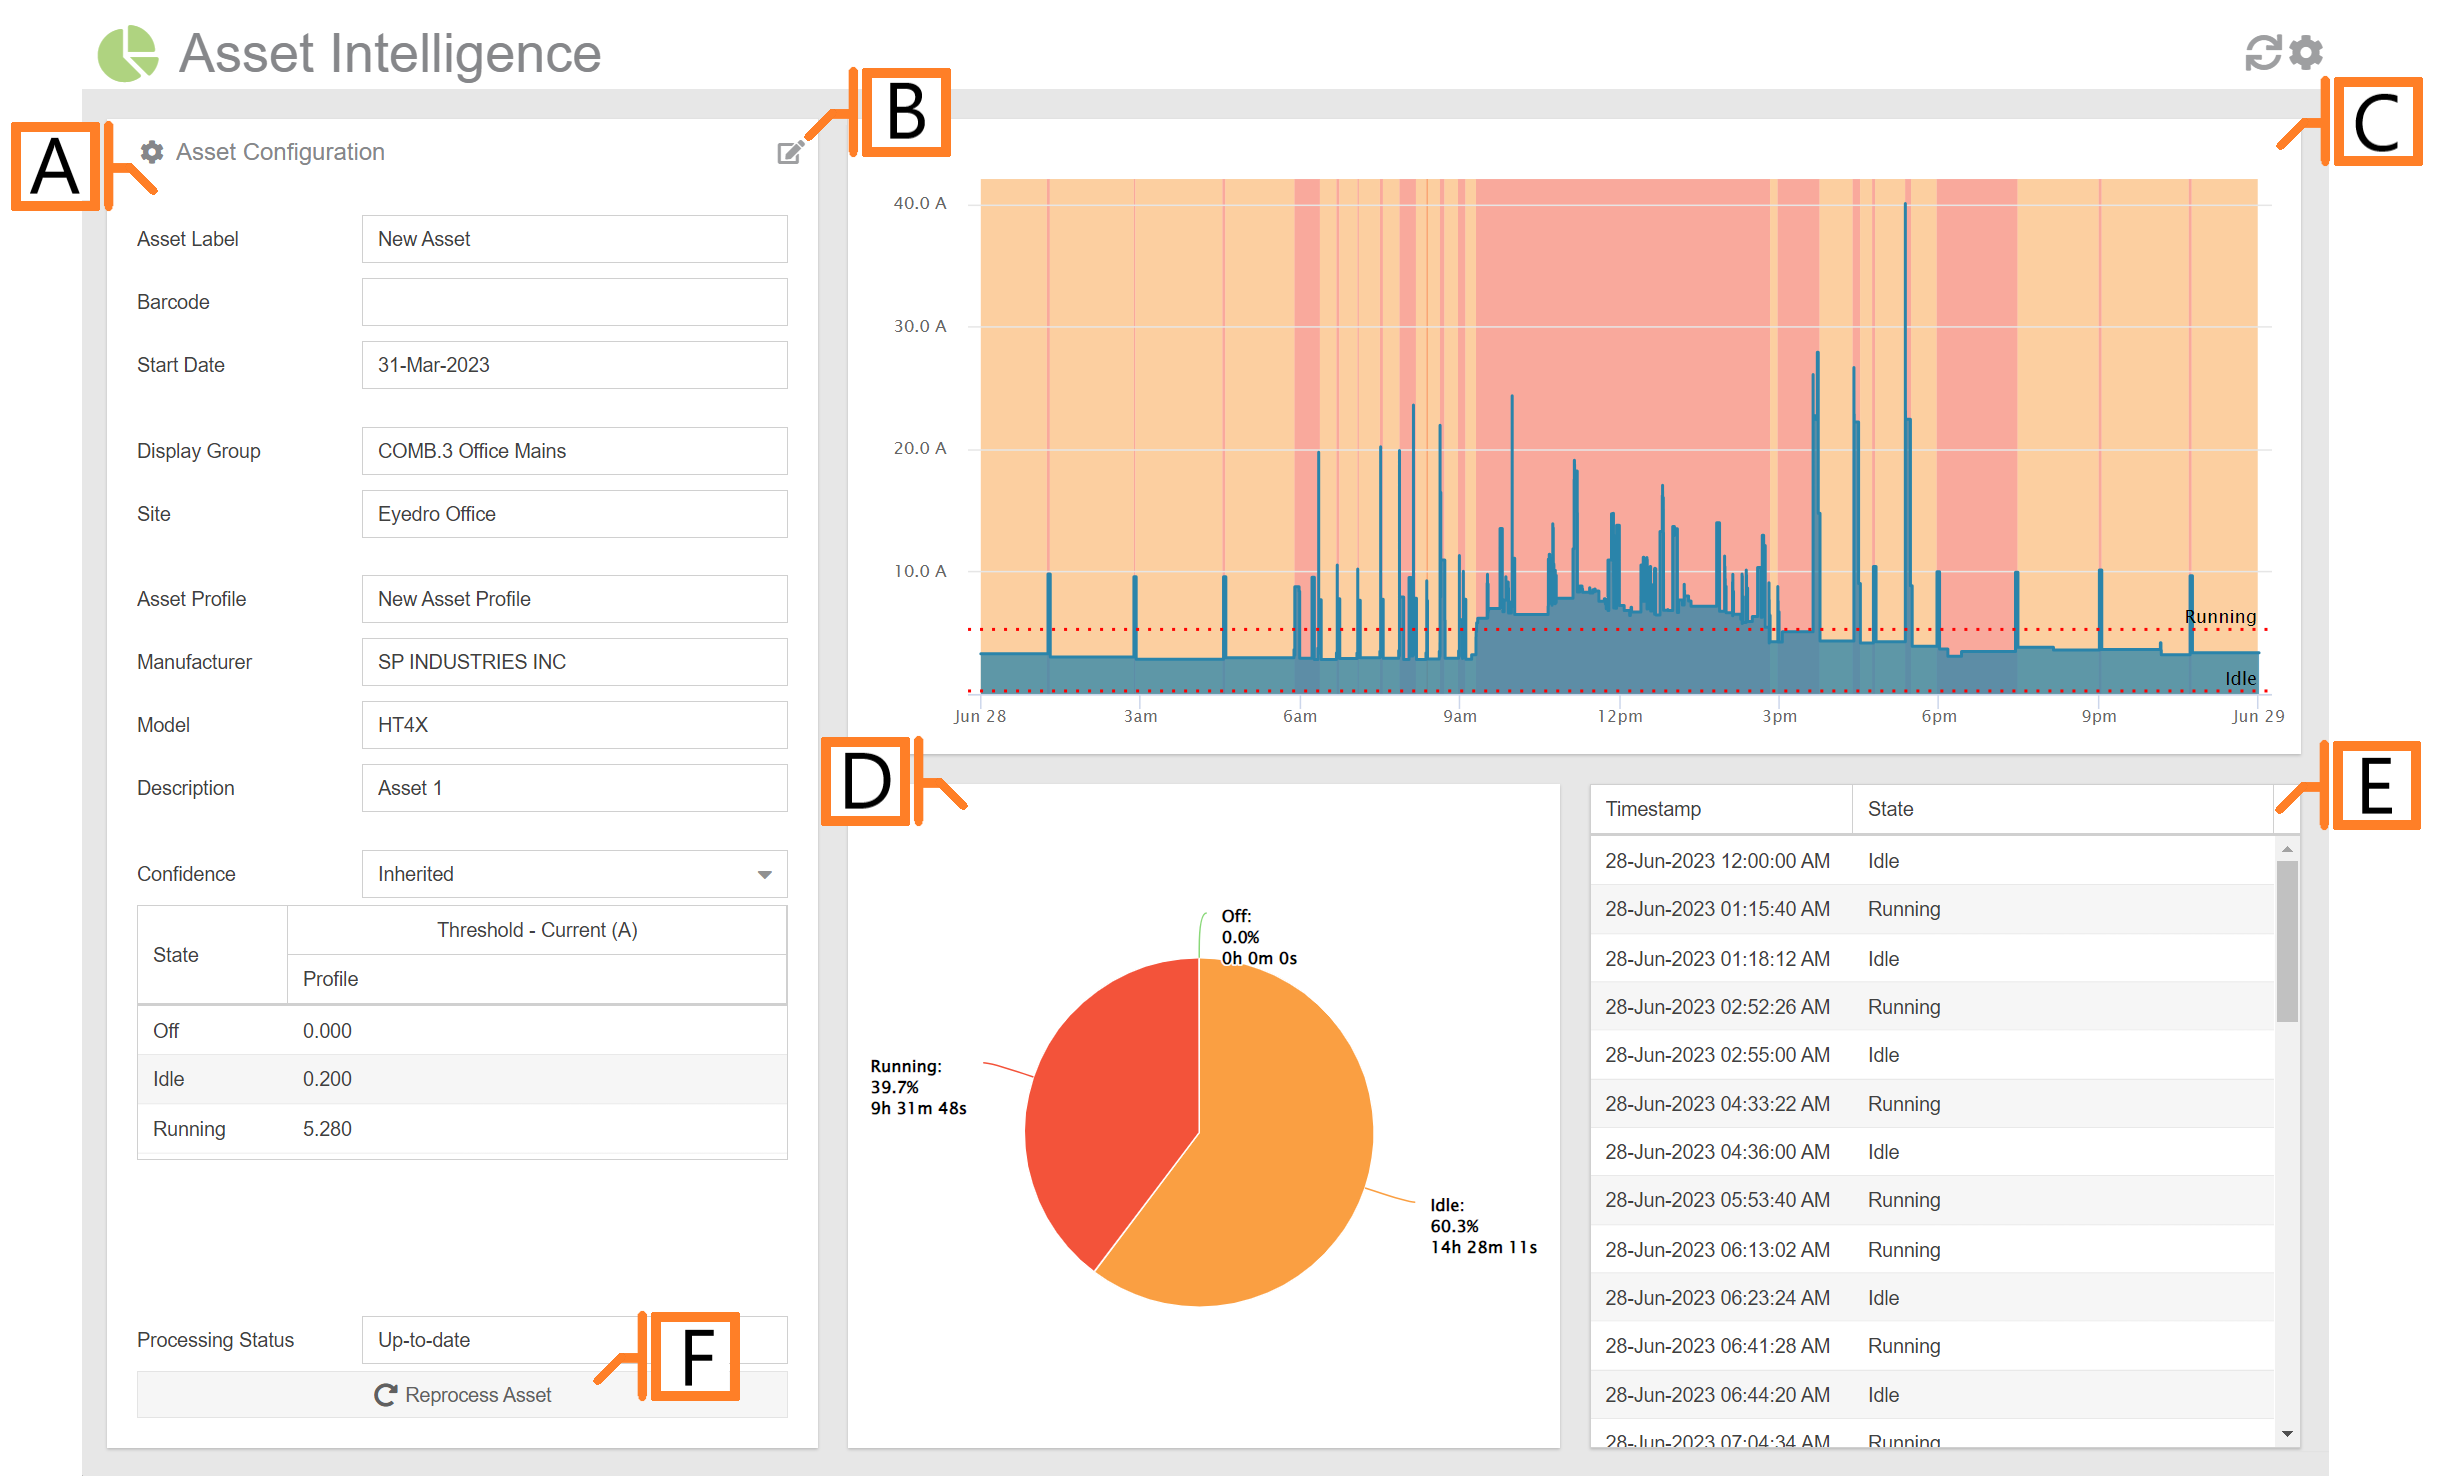
- Asset Details. Displays the currently selected asset’s configuration and profile details.
- Asset Edit button. Clicking on this button will redirect you to the Asset Configuration plugin for editing of either the asset or the asset profile associated with it.
- Run State Graph. Displays electricity demand for the selected 24 hour period. Optionally, state thresholds and state overlay can be shown on the graph.
- Utilization Chart. Pie chart indicating time spent in each state during the period and the percentage of overall time.
- Transition Details. A text based log of each state transition detected.
- Reprocess Asset button. Press this button to force the reprocessing of the asset
Asset Intelligence Plugin Tools and Options
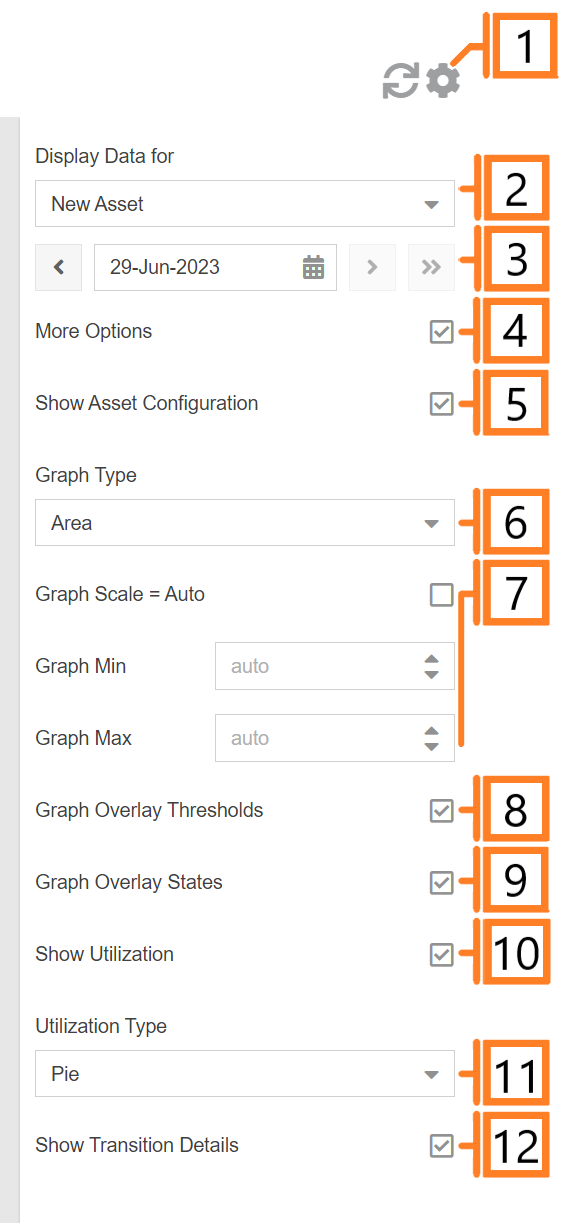
- Plugin Tools:
- Refresh. Update the data and visuals on screen.
- Options. Expand or collapse the options menu.
- Select which Asset to evaluate. NOTE: this option will only appear if there are more than one Asset defined.
- Choose the Date for which Asset data is displayed. By default this will be set to the previous date (yesterday).
- Check the More Options checkbox to show additional options
- Show/hide the Asset Configuration Panel.
- The Graph Type will change what style of graph is used to display the data. This can be either a line chart or an area chart.
- Graph Scale. Unchecking will allow the user to enter Graph Min, and Graph Max values.
- Graph Min (not shown) defines the minimum value shown on the y (vertical) data axis. Requires graph scale option to be checked.
- Graph Max (not shown) defines the maximum value shown on the y (vertical) data axis. Requires graph scale option to be checked.
- Show/hide State Threshold overlay on the Run State Graph.
- Reverse State Colors (not shown) option is used to switch the green and red colors used to identify on and off states. The idle state color is not affected. By default, the On state is identified by green and the Off state is identified by red.
- Show/hide State Overlay coloured plot bands on the Run State Graph.
- Show/hide the Utilization Chart.
- The Utilization Type will change what style of chart is used to display the data. This can be either a pie chart or a stacked bar chart.
- Show/hide the Transition Details log.