
MyEyedro Highlights Plugin
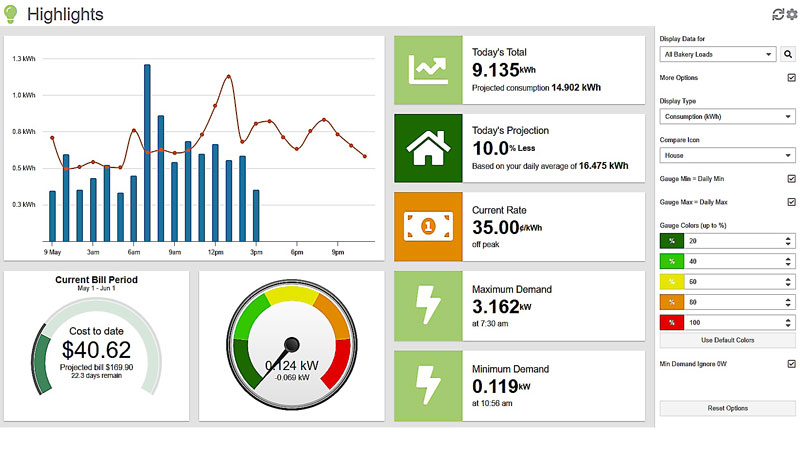
The MyEyedro Highlights plugin gives you a quick snapshot of your hourly usage for the day, current utility rate, plus minimum and maximum demand, current demand and more!
There are direct links from the MyEyedro cloud pages to the MyEyedro user guide for help on any of the Configuration menu items.
- View real-time demand
- Review rolling 4 week consumption average for time of day
- Customize demand gauge by percentage and color
In the MyEyedro power Highlights plugin first select the Display Group that you wish to view.
Toggle between cost and consumption data.
Hover over the orange line on the hourly graph to view rolling 4 week average data for a particular hour. View hourly data in the bar graph. Customize the color bands used by the Current Demand gauge. By default, colors on the gauge represent demand from 0% (green) to 100% (red) in 20% increments. View current and projected cost for the month and the current day.
Energy Monitoring Made Easy
Unlock advanced alerts, asset intelligence, asset profiles, advanced reports, RETScreen integration, and more with a MyEyedro Pro license.