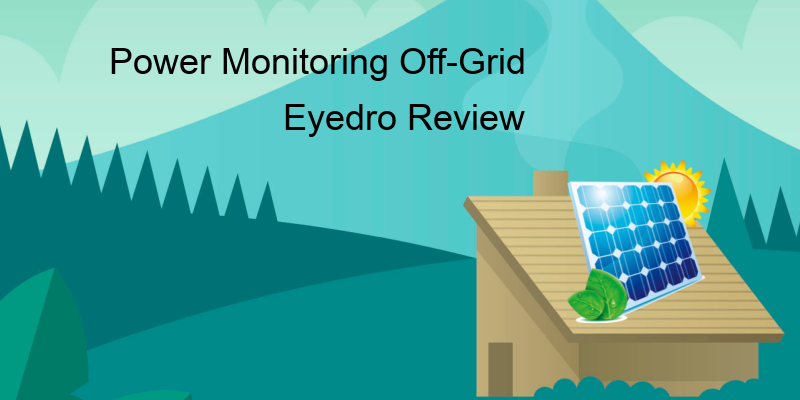
Power Monitoring Off-Grid
Power Monitoring Off-Grid – Eyedro Review
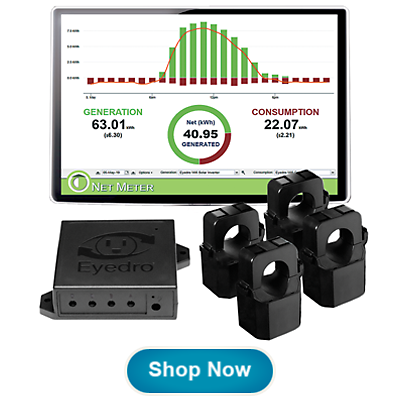
Energy Monitoring Made Easy
Follow along with Kirk of the The Forever Homestead as he discusses the challenges of living off-grid in a cold climate, the need to carefully monitor power consumption vs. solar generation and how he is using the Eyedro EYEFI-4 solar energy monitor to make that an easier task!
“Monitoring power while off grid is important for many reasons including battery health. In this video we give our feedback on a device from Eyedro Green Solutions.”
“My honest review is – it’s pretty spectacular!”
- Easy to install
- Solar ready
- Real-time data
- Free monitoring via MyEyedro.com
- Four (4) 200A sensors included, perfect for monitoring mains power plus solar generation
- Compatible with Eyedro 5A – 200A current sensors
- Connects via WiFi


Shop Now