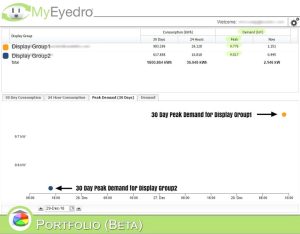
Select Page
MyEyedro Bills Plugin

MyEyedro Bills Plugin

MyEyedro Bills Plugin

With MyEyedro you have the ability to view up to 2 years of monthly Bills history, load dollar and kWh values by clicking on a specific month, adjust the start date to match the billing period of your utility, get a current usage summary as well as your projected consumption for the month and more!

There are direct links from the MyEyedro cloud pages to the MyEyedro user guide for help on any of the Configuration menu items.

Super Eyedro
  • Get at-a-glance usage information
  • View historical monthly Bills data
  • View day-by-day consumption and projections for the month

In the MyEyedro Bills plugin first select the Display Group that you wish to view. 

Display Group selector in MyEyedro

MyEyedro 

Select from a number of useful options from the right-hand panel (click the More Options checkbox).  You may need to click the gear symbol to expand the right-hand panel to view these options.

Bills plugin Options panel

Here is an example of the y-axis details option:

MyEyedro Bills y-axis details

MyEyedro Bills Panels

The Bills plugin allows you to view current Bill to Date usage, projected usage, and historical usage data by month and by day.

Electricity bills can be customized in the MyEyedro Bills plugin

More Details

Hover over the daily bars in the Bill Details panel for more information.

MyEyedro Bill Details mouseover

Hover over a monthly bar in the Billing History panel for usage data. Click on the bar to load the usage history for that month.

MyEyedro Bills plugin Billing History data

Change Your Billing Start Date

Click on the pencil icon below the Billing History panel to adjust the Bill Period start date.

MyEyedro Bills plugin bill period start date

From within the Bill Period edit panel select the month that you would like to adjust.  Note that only the start date can be changed.

MyEyedro Billing History bill period edit

Energy Monitoring Made Easy

Unlock advanced alerts, asset intelligence, asset profiles, advanced reports, RETScreen integration, and more with a MyEyedro Pro license.

Eyedro User Manuals

For detailed Eyedro product specifications, installation and MyEyedro cloud software information please refer to the following Eyedro manuals and Support menu:

MyEyedro Cloud Software Manual

Eyedro Home Products Guide

Eyedro Business Products Guide

Eyedro Technical Support

Phantom Power

Phantom Power

Phantom power: your home’s devices and appliances, when plugged in, continue to draw power even when they are off

It is called “phantom” or “standby” power, and it could account for up to 10 per cent of your home’s energy use. The average home has 25 or more electronic devices that use phantom power, costing approximately $200 or more a year in electricity. (in a 2,000 sq ft home)

Track your phantom power with the MyEyedro Phantom Energy plugin.  The MyEyedro software provides you with a 24 hour window of your phantom power usage.

hydro one energy vampires

How Do I Identify the “Phantoms”?
  • Appliances with remote controls (TV, Video and Audio Equipment)
  • Appliances with continuous digital displays (Clock on Stove, Coffee Maker)
  • Appliances with rechargeable batteries (Cordless Phones, Laptops)
  • Appliances with external power supplies (Cell Phone Chargers, Electronics)
How Do I Get Rid of the “Phantoms”?
  • Plug devices into power strips – and turn them off
  • Unplug appliances when not in use
  • Use clocks powered by rechargeable batteries

When buying new appliances, choose appliances with low standby power and look for the Energy Star symbol

For more information on Home Energy Monitoring please visit https://eyedro.com/

Big Savings with LED Lighting

Big Savings with LED Lighting

Big Savings with LED Lighting


big savings with led lighting

*Based on 2 hours per day @ 0.10/kWh

Which Type of Light Bulbs Should you Choose?


In these days of rising electricity prices it may be time for a whole home light bulb retrofit.  With a quick look at the above infographic it quickly becomes apparent that significant savings are to be had by swapping out incandescent bulbs for LED lighting.

Incandescent bulbs are inexpensive to purchase but tremendously inefficient as they dissipate most of the energy they consume as heat.

The cost of running one 60 watt incandescent bulb for 2 hours per day at 10 cents/kWh, would cost $4.38 per year.  The 15 watt compact fluorescent equivalent would cost $1.10 per year and the LED version comparable to the 60 watt incandescent would only cost $0.66!  Now multiply that by the average number of bulbs in a home.

The average number of light bulbs in a home is 24 according to Natural Resources Canada’s Office of Energy Efficiency 2007 statistics.  When you multiply the yearly dollar figures of the incandescent and LED bulb by 24 that’s when the savings opportunities really become obvious:  $105.12 vs. $15.84!

While initially LED bulbs were quite expensive to purchase, they have in recent years come down in price and are now very affordable.


The advantages of LED lighting are clear:
  • Extremely energy efficient compared to traditional light bulbs
  • No toxic mercury risk like CFL
  • Affordable
  • Very long life if you purchase good quality bulbs (this may or may not apply to dollar store finds – caveat emptor)

Try a little experiment!  Install each type of bulb one by one in a lamp and check how much power is being consumed using your Eyedro Real-Time Electricity Monitor.  Saving electricity can be fun, saving money even better.


Ready to dig a little deeper into your energy usage?
New MyEyedro Peak Electricity Demand Plugin

New MyEyedro Peak Electricity Demand Plugin

Prompted by popular “demand” for a means to capture electricity demand, Eyedro is pleased to announce the addition of the new Portfolio plugin to our MyEyedro electricity monitoring platform.

The Portfolio view allows the MyEyedro user to determine 30 Day Peak Demand selectable by date, Instantaneous Peak Demand, 24 Hour and 30 Day Consumption.

In order to activate the Portfolio plugin the user’s MyEyedro account must have at least 2 display groups. In the case where a user has only one Eyedro device, a duplicate display group can be created.

For more information on the Portfolio plugin see page 58 of the MyEyedro User Guide.

Electricity Demand Explained

Electricity Demand is the maximum amount of electricity being used at any given point in time. Demand fluctuates throughout the day. For example, in the morning as people get up and get ready for work, take showers, run their cappuccino machines, hair dryers or waffle makers, electricity demand increases. In the early evening there is a second period of peak demand as people arrive home from work, turn on lights and appliances, cook dinner, fire up computers, etc. The greater the electricity demand, the greater the strain on the electrical grid to supply that demand, which is why many utilities will charge the consumer more during times of peak demand (Time-of-Use electricity rates). Time-of-Use rates are intended to take some of the strain off the grid by encouraging conservation at times of peak demand.

30 Day Consumption View:

MyEyedro Electricity Usage Metering 30 Day Consumption Data

30 Day electricity Consumption Data

24 Hour Consumption View:

MyEyedro Electricity Usage Metering 24 hour Consumption Data

24 Hour Electricity Consumption Data

Case Study – Why Is My Bill So High?

Case Study – Why Is My Bill So High?

billsSometimes a consistently high electricity bill can be a complete mystery, despite your best efforts to uncover the truth.

One recent Eyedro customer had been struggling for a couple years with extremely high bills but couldn’t identify the cause.  “There were a lot of different factors in play and several changes had taken place in a short amount of time.”  The homeowner had done a significant addition to his home; increasing the size among other things, but also installing a hot tub and geothermal HVAC system.  “I knew the geo system would increase my electricity bill.  I also knew increasing the size of the home would have an impact.”  However, the increase was not in line with his expectations.

After a couple seasons and seeing consistent winter bills of 90 kWh a day (and almost as high in the summer), a portable electricity monitor was used to help identify the problem.  The homeowner spent weeks trying to figure out the problem.  He was able to load information from the different appliances, but was still unable to understand why the daily usage was so high.  “As expected, the geo was using a lot of power, but when it was on, the kWh were inline with expectations.”  Still, he believed the HVAC was at the heart of the problem.

Then he installed Eyedro’s electricity monitor.   Within a couple days he had identified the source of the problem, if not the cause.


After making several adjustments to their home they knew their bills would increase, but not by that much.

After making several adjustments to their home they knew their bills would increase, but not by that much.

Every day at around 3 PM to approximately 3 AM, there was a dramatic increase in usage.  With Eyedro, you are able to identify that it’s a 220V appliance, reducing it to two or three possibilities.  In the end, the homeowner was able to confirm it was the HVAC system.  However, the system was turned off at the thermostat, meaning no air conditioner or heater running. It was mid-spring and the outdoor temperature was already in the 80’s but cool enough at night to go without HVAC cooling.  So what was the problem.  It turns out the in-floor system used a pre-heat tank before circulating to the two in-floor zones.  While the thermostat was set to “off” and clearly warm enough to not need heating, the pre-heat system was “regenerating” or “pre-heating” the tank for 12 hours a day!

Customer was able to find a 40% energy reduction in his home just by monitoring where his energy was going.

Customer was able to find a 40% energy reduction in his home just by monitoring where his energy was going.

While the exact cause (or fix) has not been identified, with the in-floor system completely shut off manually, the electricity usage has been reduced by about 30 kWh per day, or 40%!