by Nick Gamble | Jul 31, 2024
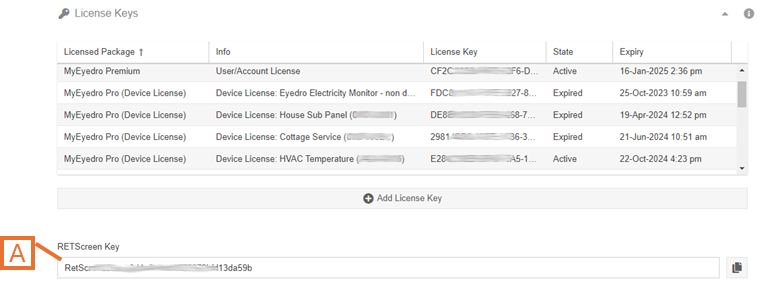
The RETScreen® Clean Energy Management Software platform enables low-carbon planning, implementation, monitoring and reporting. For users with a MyEyedro Premium or Professional license, a RETScreen Key is available for integration in your RETScreen Dashboard.
Get your RETScreen Key at the bottom of the License Keys panel of the User Configuration plugin.

by Nick Gamble | Jul 29, 2024
The Usage Ranking report type provides a ranked list of all Display Groups or Sites included in the assessment along with relevant consumption metrics.
The Usage Ranking report is only available to users with a MyEyedro Premium or Professional license.
Report profiles can be created and modified in the MyEyedro Report Configuration plugin and all generated reports can be viewed in the MyEyedro Report Viewer plugin.
Display Group Report Grouping

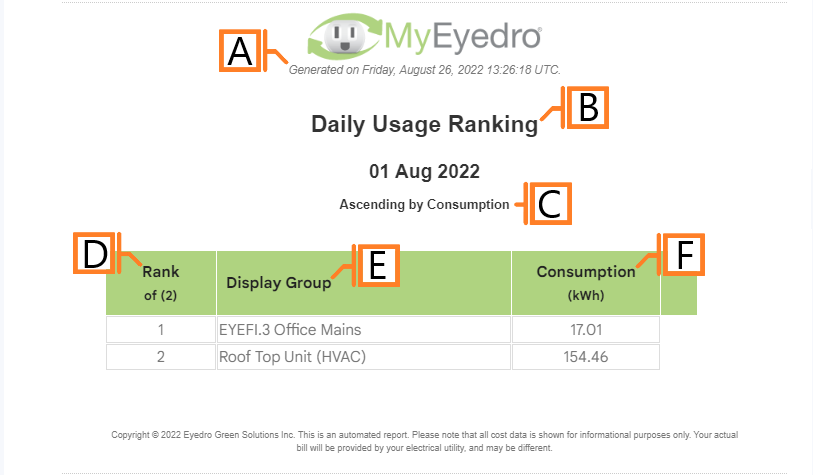
- Generation Date. The date and time the report was generated.
- Report Title. This is a combination of the report title text and report period as defined in the report configuration options.
- Ranking Method. The method and direction of the ranked results.
- Rank. Display groups rank based on the ranking method configured.
- Display Group. Label of the ranked display group.
- Consumption. The total power consumption by the display group during the reporting period.
Site Report Grouping
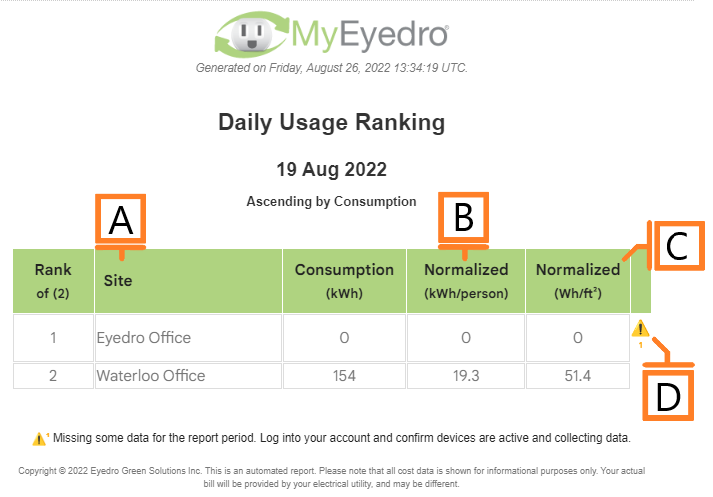
- Site. Label of the ranked Site.
- kWh/Person. Consumption that has been normalized based on the building (Site) occupancy info.
- Wh/Floorspace. Consumption that has been normalized based on the building (Site) floorspace info.
- Warnings. Indicates that issues have been detected during report generation.
Configuration Options

- Sorting Method. The property on which to rank each Display Group or Site. Choose one of Consumption, Consumption by Area (Site only), or Consumption by Occupancy (Site only).
- Sort Direction. The direction to sort row entries according to Sorting Method (i.e. ascending/descending).
NOTE: Common report configuration options are not shown:
- Report Type. Specify the type of report to generate. Choose Usage Ranking.
- Report Grouping. Specify whether the report will use Display Groups or Sites as a data source.
- Report Period. The time frame which the Report will evaluate. NOTE: Usage Ranking reports only support Daily reporting period.
- Report Title. Used to easily identify what this Report Profile is being used for.
- Include All Display Groups. Ensure this option is checked to include all Display Groups in the report.
- Display Group to. Allows you to specify a list of Display Groups to include or exclude from the report. NOTE: This option is not available if the Include All Display Groups option is checked.
- Scheduled. Automatically generates a report on the scheduled start day and each period there after.
- Effective Date. The first date your report is scheduled to run. NOTE: this option is only visible for scheduled reports.
- Email Recipients. The Email addresses you wish a copy of the scheduled report to automatically be sent to. NOTE: this option is only visible for scheduled reports.
by Nick Gamble | Jul 29, 2024
The Renewable Generation Ranking report type provides a ranked list of all Display Groups/Sites included in the assessment along with relevant generation and revenue metrics.
The Renewable Generation Ranking report is only available to users with a MyEyedro Premium or Professional license.
Report profiles can be created and modified in the MyEyedro Report Configuration plugin and all generated reports can be viewed in the MyEyedro Report Viewer plugin.

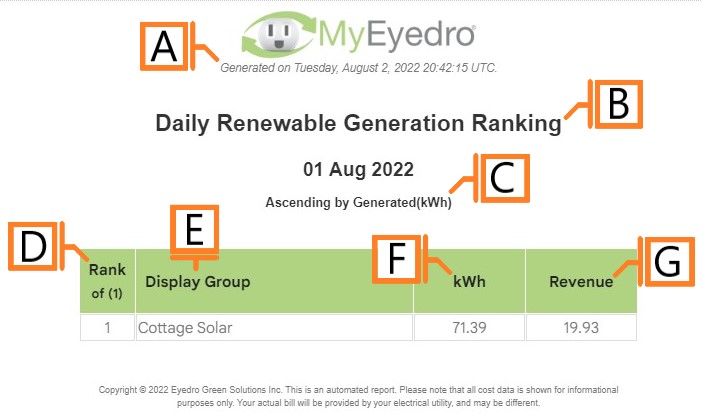
- Generation Date. The date and time the report was generated.
- Report Title. This is a combination of the report title text and report period as defined in the report configuration options.
- Ranking Method. The method and direction of the ranked results.
- Rank. Display groups rank based on the ranking method configured.
- Display Group. Label of the ranked display group.
- Generated. The total power generation by the display group during the reporting period.
- Revenue. The total revenue recognized by the display group during the reporting period.
Configuration Options

- Sorting Method. The property on which to rank each Display Group. Choose one of Alphabetically, by Generation or by Revenue.
- Sort Direction. The direction to sort row entries according to Sorting Method (i.e. ascending/descending).
NOTE: Common report configuration options are not shown:
- Report Type. Specify the type of report to generate. Choose Renewable Generation Ranking.
- Report Grouping. Specify whether the report will use Display Groups or Sites as a data source. NOTE: Renewable Generation Ranking reports only support Display Groups.
- Report Period. The time frame which the Report will evaluate. Choose one of Daily or Weekly.
- Report Title. Used to easily identify what this Report Profile is being used for.
- Include All Display Groups. Ensure this option is checked to include all Display Groups in the report.
- Display Group to. Allows you to specify a list of Display Groups to include or exclude from the report. NOTE: This option is not available if the Include All Display Groups option is checked.
- Scheduled. Automatically generates a report on the scheduled start day and each period there after.
- Effective Date. The first date your report is scheduled to run. NOTE: this option is only visible for scheduled reports.
- Email Recipients. The Email addresses you wish a copy of the scheduled report to automatically be sent to. NOTE: this option is only visible for scheduled reports.
by Nick Gamble | Jul 29, 2024
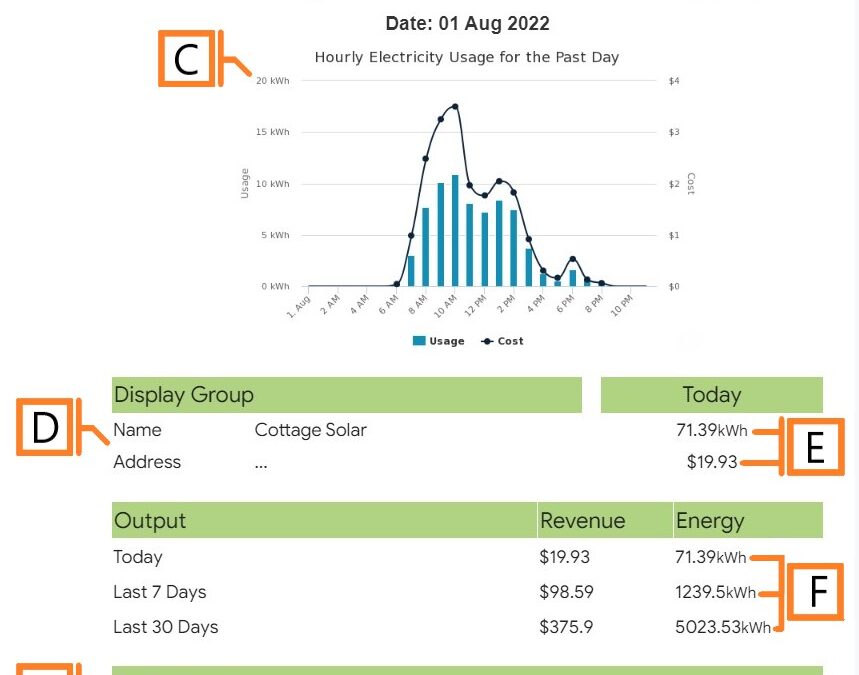
The Renewable Generation Metrics report type provides statistics on energy generated, cost savings, and peak performance over multiple periods.
The Renewable Generation Metrics report is only available to users with a MyEyedro Premium or Professional license.
Report profiles can be created and modified in the MyEyedro Report Configuration plugin and all generated reports can be viewed in the MyEyedro Report Viewer plugin.
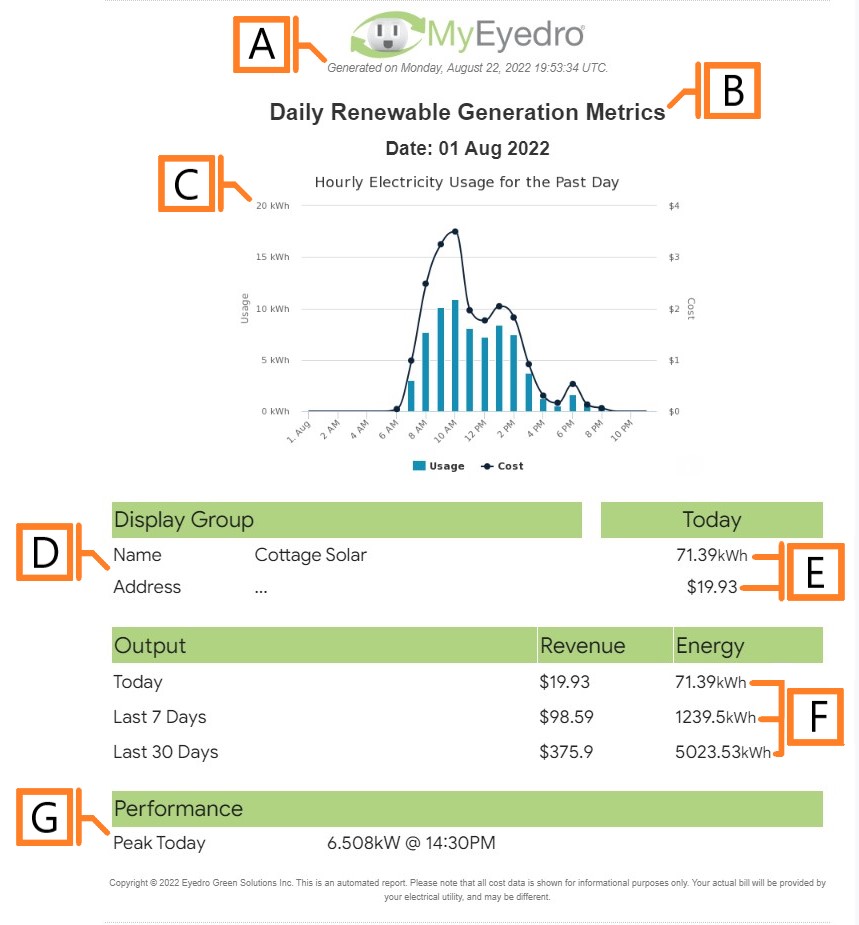
- Generation Date. The date and time the report was generated.
- Report Title. This is a combination of the report title text and report period as defined in the report configuration options.
- Graph. A graphical representation of the power generation and revenue data for the reporting period.
- Display Group. The display group and physical address of its corresponding Site, if available.
- Today. Generation and revenue for the present day.
- Output. Generation and revenue for the present day, past 7 days and past 30 days period.
- Performance metrics.
Configuration Options
NOTE: Common report configuration options are not shown:
- Report Type. Specify the type of report to generate. Choose Renewable Generation Metrics.
- Report Grouping. Specify whether the report will use Display Groups or Sites as a data source. NOTE: Renewable Generation Metrics reports only support Display Groups.
- Report Period. The time frame which the Report will evaluate. NOTE: Renewable Generation Metrics reports only support Daily reporting period.
- Report Title. Used to easily identify what this Report Profile is being used for.
- Scheduled. Automatically generates a report on the scheduled start day and each period there after.
- Effective Date. The first date your report is scheduled to run. NOTE: this option is only visible for scheduled reports.
- Email Recipients. The Email addresses you wish a copy of the scheduled report to automatically be sent to. NOTE: this option is only visible for scheduled reports.
by Nick Gamble | Jul 29, 2024
The MyEyedro Meter plugin emulates the functionality of a physical meter providing live readouts and recent historical data for individual sensors of the selected Display Group. It supports electricity data (A, V, PF, kW), temperature data (°C, °F) or volumetric data (flow and pulse count) from various types of Eyedro Monitoring products.
The Meter plugin is only available to users with a MyEyedro Premium or Professional license.
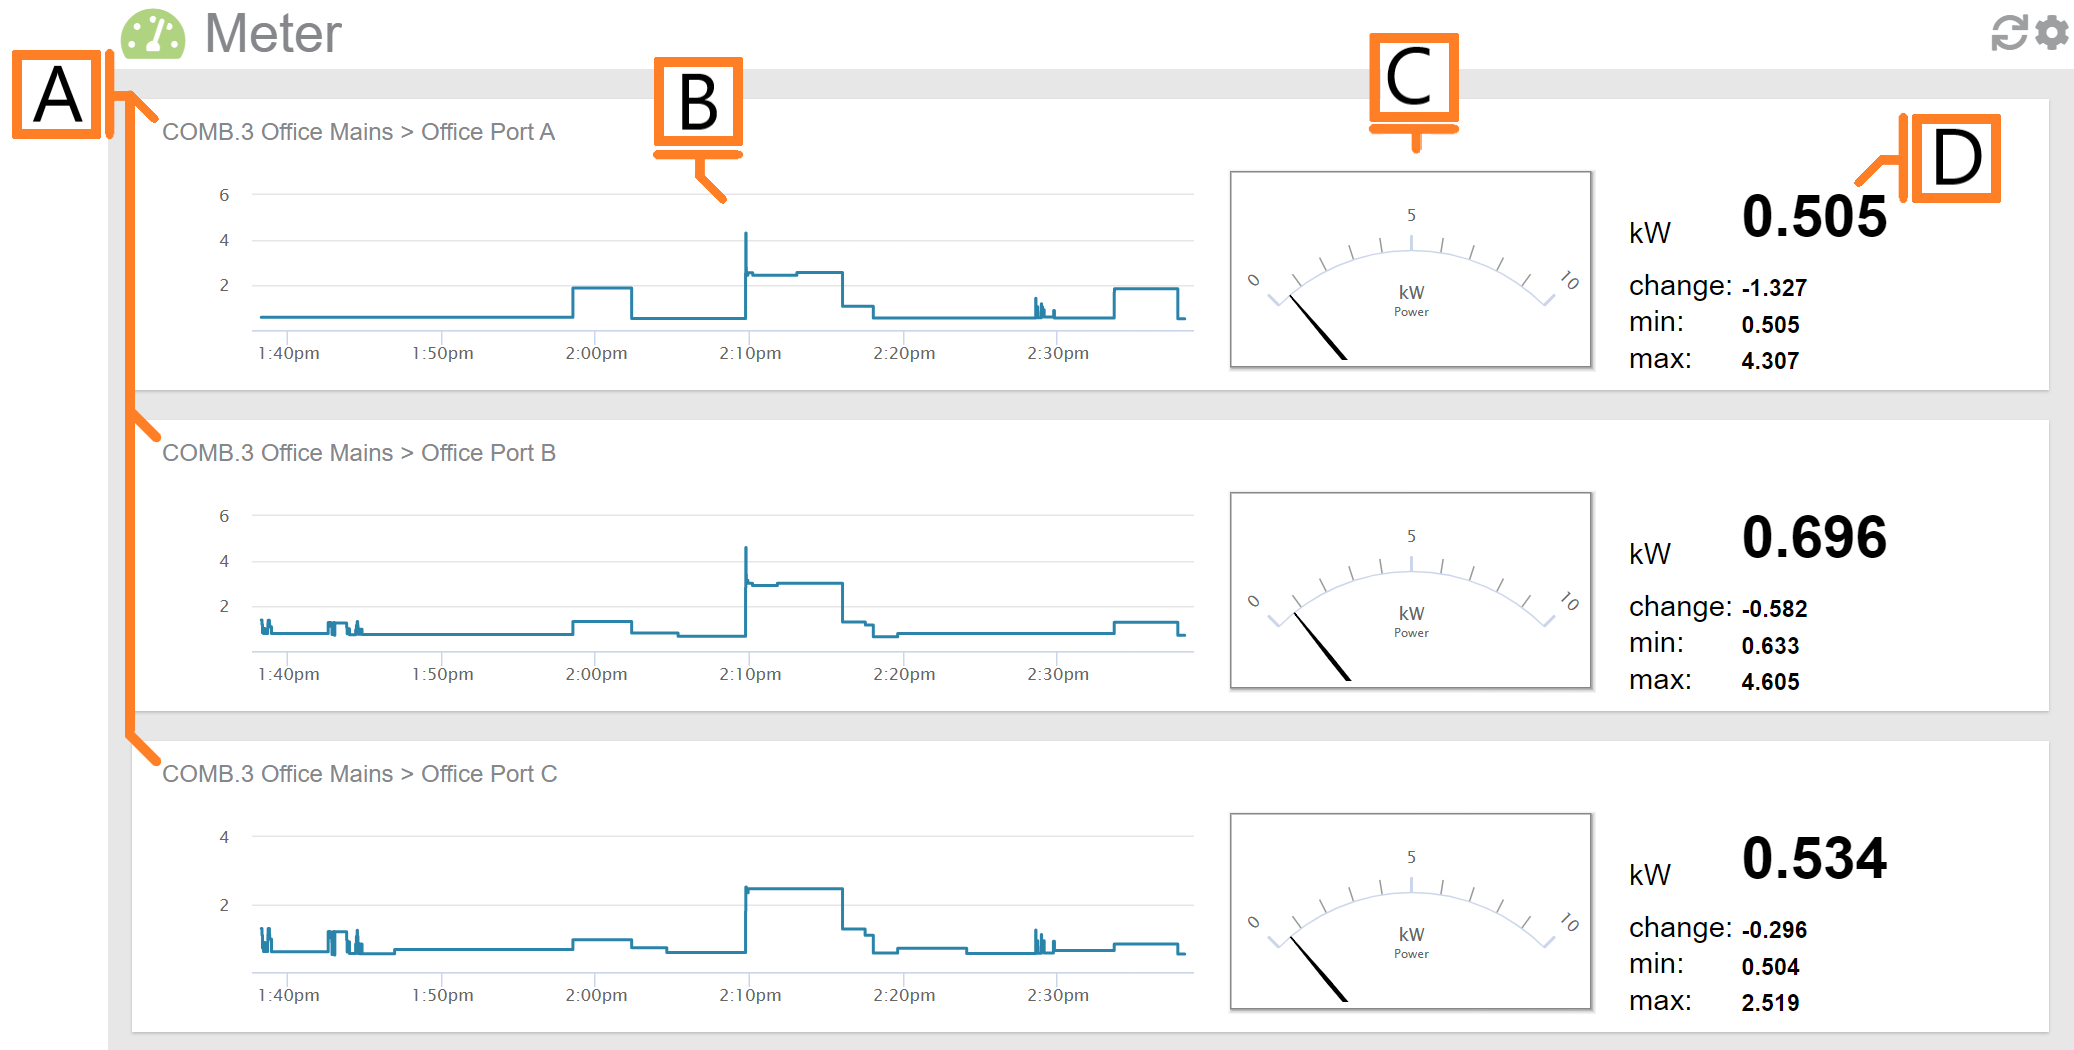
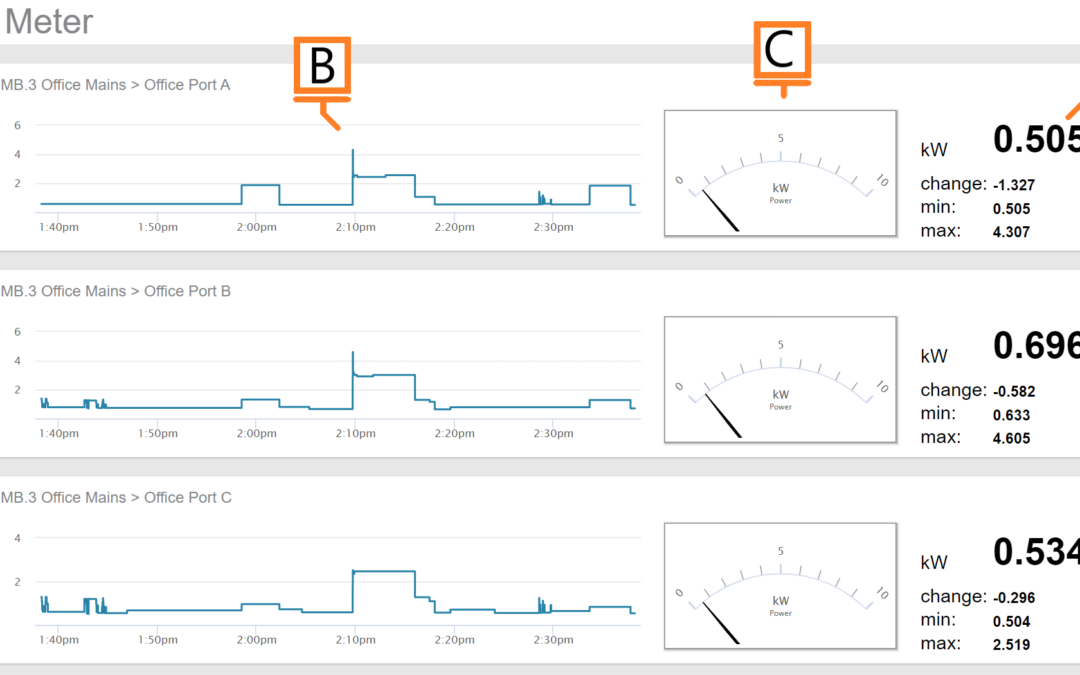
- Sensor Region. There will be one region for each sensor in the selected Display Group.
- Demand Graph. Displays demand measurements for the selected period.
- Demand Gauge. Displays the most recent demand measurement.
- Statistics. Displays the most recent reading, last change as well as minimum and maximum values for the selected period.
Meter Plugin Tools and Options
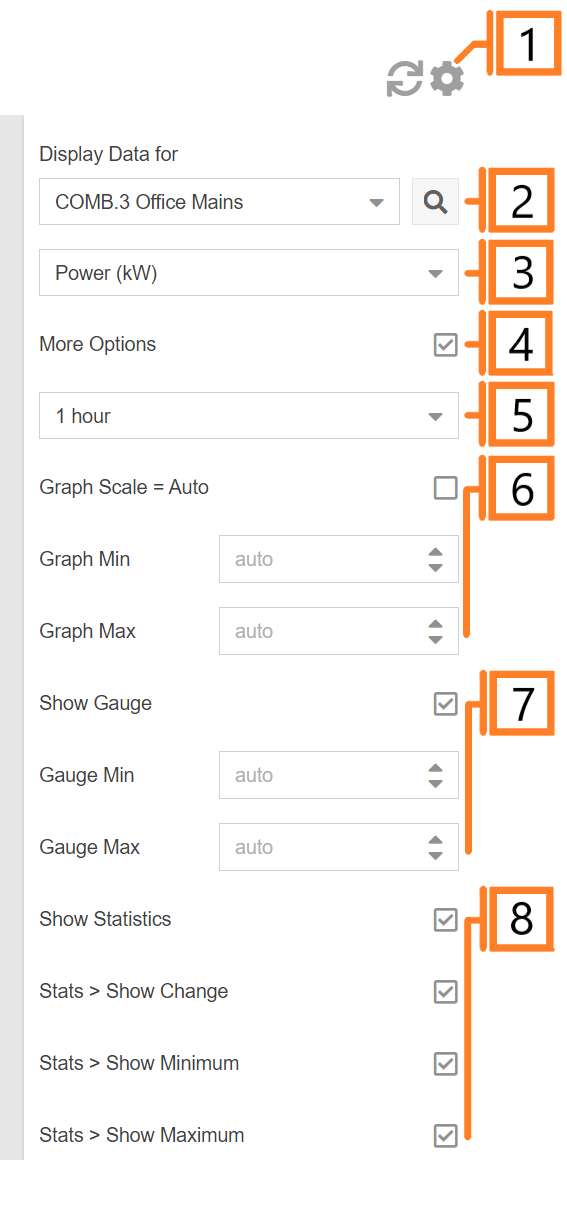
- Plugin Tools:
- Refresh. Update the data and visuals on screen.
- Options. Expand or collapse the options menu.
- Select which Display Group to evaluate.
- Specify Display Units:
- Electricity: Power (kW), Current (A), Voltage (V) or Power Factor (PF).
- Temperature: Celsius (°C), Fahrenheit (°F).
- Volumetric (pulse): Flow (units/sec), Flow (units/min), Pulse Count (pulses).
- Check the More Options checkbox to show additional options.
- Choose the period for the Demand Graph and corresponding Statistics panel.
- Graph Scale: Unchecking will allow the user to enter Graph Min, and Graph Max values.
- Gauge Scale: Unchecking will allow the user to enter Gauge Min, and Gauge Max values.
- Show/hide statistics for all sensors.


