by Nick Gamble | Jul 29, 2024
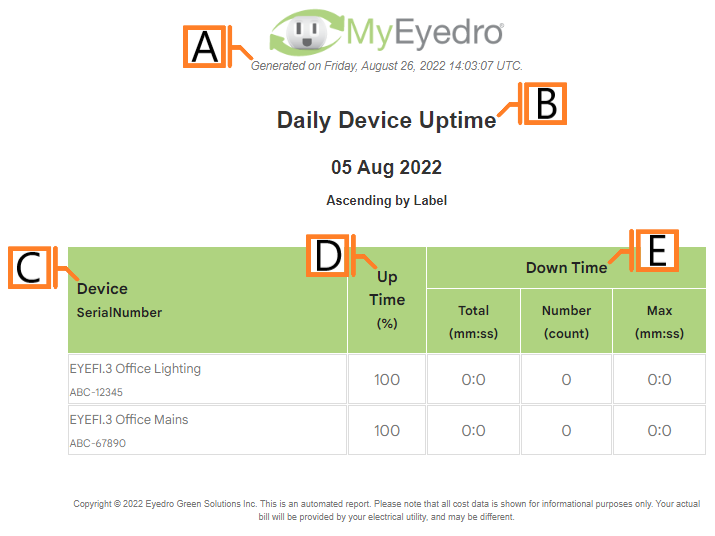
The Device Uptime report type provides a ranked list of all Devices included in the assessment along with metrics on their connectivity over the report period (i.e. active vs. inactive time).
The Device Uptime report is only available to users with a MyEyedro Professional license.
Report profiles can be created and modified in the MyEyedro Report Configuration plugin and all generated reports can be viewed in the MyEyedro Report Viewer plugin.
- Generation Date. The date and time the report was generated.
- Report Title. This is a combination of the report title text and report period as defined in the report configuration options.
- Label. Report grouping (i.e. Device, Display Group or Site) label and device serial number.
- Up Time. Percentage of time the Device was actively connected to our hardware servers over the report period.
- Down Time. Downtime metrics over the report period including the total time spent inactive, number of lost communication events, and the longest outage duration.
Configuration Options

- Sorting Method. The property on which to sort the Devices in the report. Choose one of Alphabetically, by Up Time, by Down Time or by Offline Count.
- Sort Direction. The direction to sort row entries according to Sorting Method (i.e. ascending/descending).
NOTE: Common report configuration options are not shown:
- Report Type. Specify the type of report to generate. Choose Device Uptime.
- Report Grouping. Specify whether the report will use Devices, Display Groups or Sites as a data source.
- Report Period. The time frame which the Report will evaluate. Choose one of Daily or Weekly.
- Report Title. Used to easily identify what this Report Profile is being used for.
- Include All (Devices, Display Groups or Sites). Ensure this option is checked to include all available items in the report.
- Devices, Display Groups or Sites to. Allows you to specify a list of items to include or exclude from the report. NOTE: This option is not available if the Include All option is checked.
- Scheduled. Automatically generates a report on the scheduled start day and each period there after.
- Effective Date. The first date your report is scheduled to run. NOTE: this option is only visible for scheduled reports.
- Email Recipients. The Email addresses you wish a copy of the scheduled report to automatically be sent to. NOTE: this option is only visible for scheduled reports.
by Nick Gamble | Jul 29, 2024
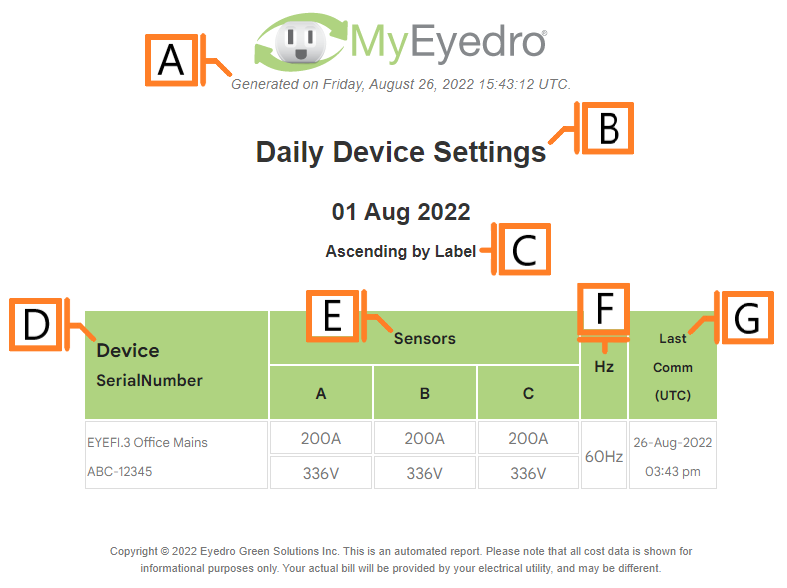
The Device Settings report type provides a list of current hardware settings for each Device included in the assessment. NOTE: Currently this report is limited to 2nd generation Eyedro electricity monitoring products.
The Device Settings report is only available to users with a MyEyedro Professional license.
Report profiles can be created and modified in the MyEyedro Report Configuration plugin and all generated reports can be viewed in the MyEyedro Report Viewer plugin.
- Generation Date. The date and time the report was generated.
- Report Title. This is a combination of the report title text, display group label and report period as defined in the report configuration options.
- Sorting Method. The method and direction used for sorting the device list.
- Label. Report grouping (i.e. Device, Display Group or Site) label and device serial number.
- Sensors. The sensor amperage rating and hardcoded voltage configured in this device’s settings.
- Frequency. The line frequency configured in this device’s settings.
- Last Communication. The date and time this device last communicated with our MyEyedro hardware servers.
Configuration Options

- Sorting Method. The property on which to sort the Devices in the report. Choose one of Alphabetically, by Frequency or by Last Communication Time.
- Sort Direction. The direction to sort row entries according to Sorting Method (i.e. ascending/descending).
NOTE: Common report configuration options are not shown:
- Report Type. Specify the type of report to generate. Choose Device Settings.
- Report Grouping. Specify whether the report will use Devices, Display Groups or Sites as a data source.
- Report Period. The time frame which the Report will evaluate. Choose one of Daily or Weekly.
- Report Title. Used to easily identify what this Report Profile is being used for.
- Include All (Devices, Display Groups or Sites). Ensure this option is checked to include all available items in the report.
- Devices, Display Groups or Sites to. Allows you to specify a list of items to include or exclude from the report. NOTE: This option is not available if the Include All option is checked.
- Scheduled. Automatically generates a report on the scheduled start day and each period there after.
- Effective Date. The first date your report is scheduled to run. NOTE: this option is only visible for scheduled reports.
- Email Recipients. The Email addresses you wish a copy of the scheduled report to automatically be sent to. NOTE: this option is only visible for scheduled reports.
by Nick Gamble | Jul 29, 2024
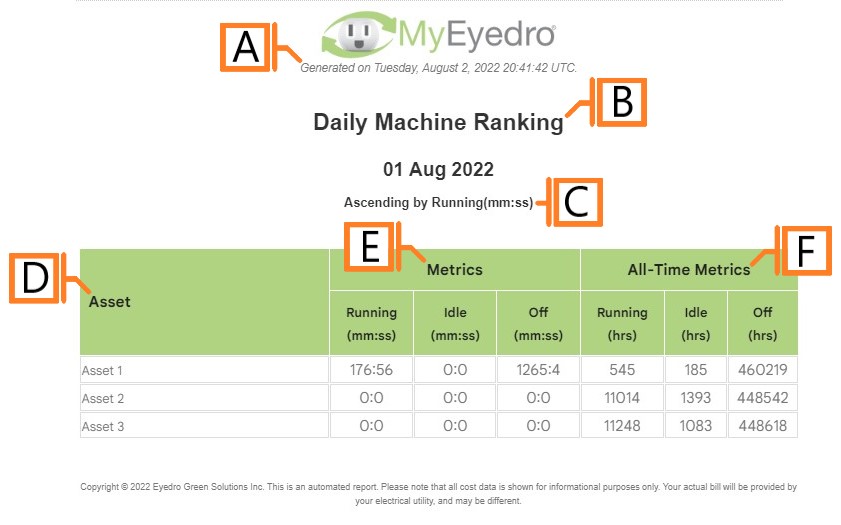
The Asset Ranking report type provides a ranked list of all Assets included in the assessment along with relevant runstate metrics.
The Asset Ranking report is only available to users with a MyEyedro Professional license.
Report profiles can be created and modified in the MyEyedro Report Configuration plugin and all generated reports can be viewed in the MyEyedro Report Viewer plugin.
- Generation Date. The date and time the report was generated.
- Report Title. This is a combination of the report title text and report period as defined in the report configuration options.
- Ranking Method. The method and direction of the ranked results.
- Asset. The user assigned Asset label.
- Metrics (period). Metrics for time spent in each run-state for the reporting period.
- Metrics (overall). Metrics for time spent in each run-state overall (since Asset creation).
Configuration Options

- Sorting Method. The property on which to rank each Asset. Choose one of Alphabetically or by Run Time, Idle Time or Off Time for either the reporting period or overall.
- Sort Direction. The direction to sort row entries according to Sorting Method (i.e. ascending/descending).
NOTE: Common report configuration options are not shown:
- Report Type. Specify the type of report to generate. Choose Asset Ranking.
- Report Grouping. NOTE: Asset Ranking reports only support Assets.
- Report Period. The time frame which the Report will evaluate. Choose one of Daily or Weekly.
- Report Title. Used to easily identify what this Report Profile is being used for.
- Scheduled. Automatically generates a report on the scheduled start day and each period there after.
- Effective Date. The first date your report is scheduled to run. NOTE: this option is only visible for scheduled reports.
- Email Recipients. The Email addresses you wish a copy of the scheduled report to automatically be sent to. NOTE: this option is only visible for scheduled reports.
by Nick Gamble | Jul 29, 2024
The Asset Metrics report type provides detailed run-state analysis and accompanying metrics.
The Asset Metrics report is only available to users with a MyEyedro Professional license.
Report profiles can be created and modified in the MyEyedro Report Configuration plugin and all generated reports can be viewed in the MyEyedro Report Viewer plugin.
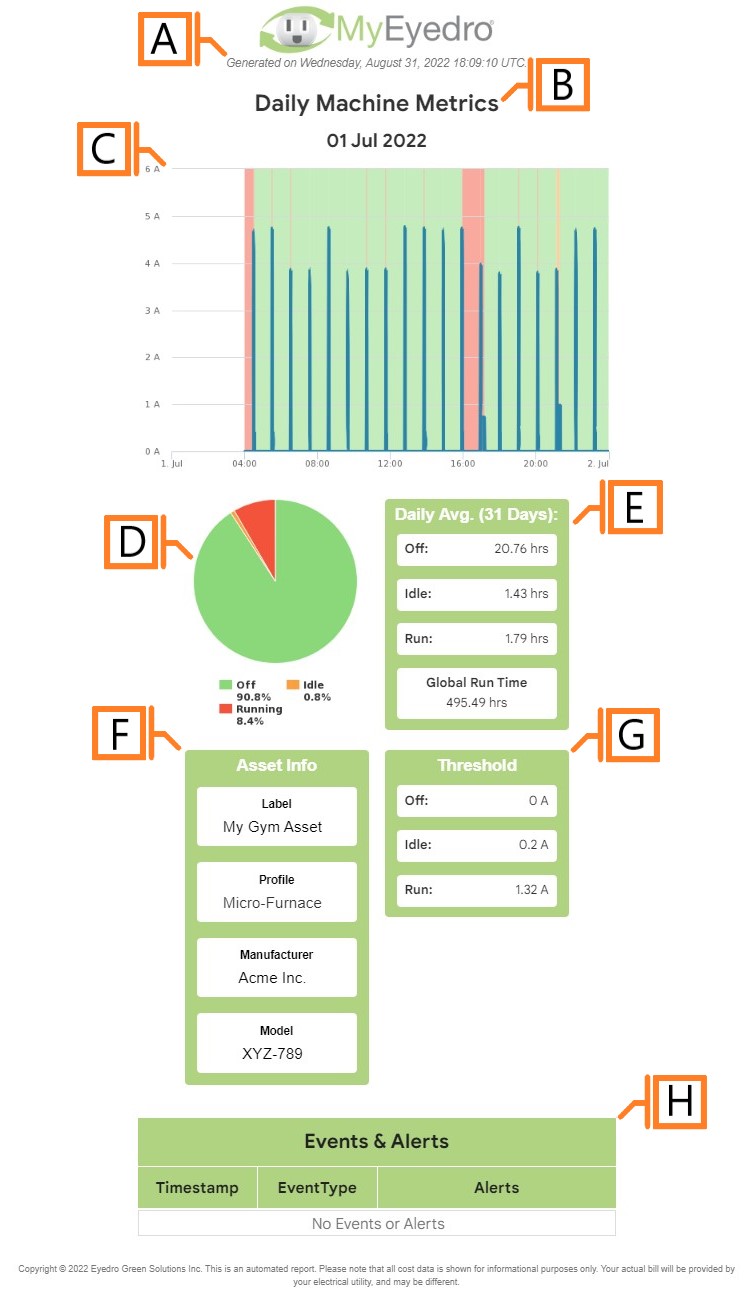
- Generation Date. The date and time the report was generated.
- Report Title. This is a combination of the report title text and report period as defined in the report configuration options.
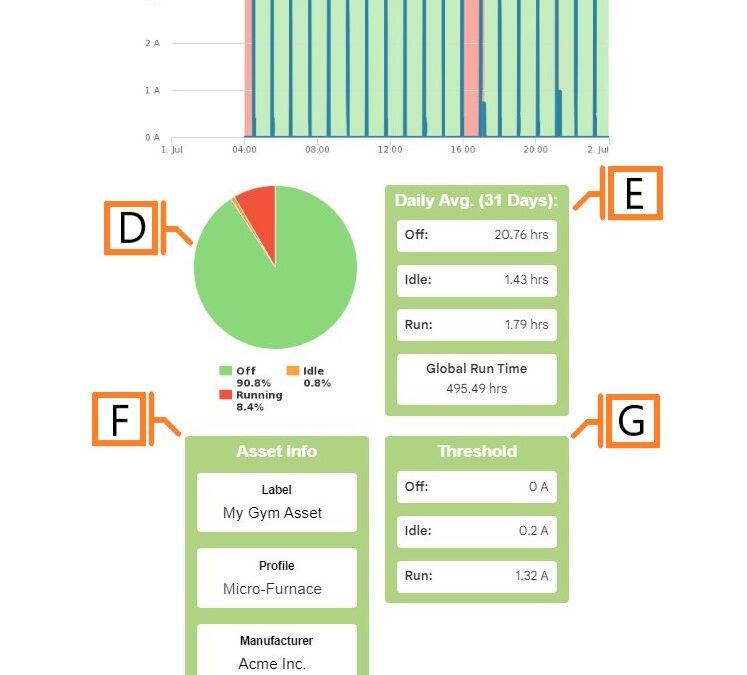
- Graph. A graph plotting the asset’s amperage draw (blue line) and corresponding run-state (green, orange, and red highlights) over the report period.
- Pie Chart. A pie chart breaking down the percentage of time spent in each run-state over the report period.
- Daily Metrics. Metrics detailing the average duration spent in each run-state over the past 31 days as well as global asset run time (total hours running since Asset creation).
- Asset Info. Asset information such as the user assigned Label, Asset Profile, Manufacturer, and Model Number.
- Run-State Thresholds. The amperage thresholds for each run-state.
- Events and Alerts table. A table listing asset events/alerts that occurred over the report period.
Configuration Options
NOTE: Common report configuration options are not shown:
- Report Type. Specify the type of report to generate. Choose Asset Metrics.
- Report Grouping. NOTE: Asset Metrics reports only support Assets.
- Report Period. The time frame which the Report will evaluate. Choose one of Daily or Weekly.
- Report Title. Used to easily identify what this Report Profile is being used for.
- Scheduled. Automatically generates a report on the scheduled start day and each period there after.
- Effective Date. The first date your report is scheduled to run. NOTE: this option is only visible for scheduled reports.
- Email Recipients. The Email addresses you wish a copy of the scheduled report to automatically be sent to. NOTE: this option is only visible for scheduled reports.
by Nick Gamble | Jul 29, 2024
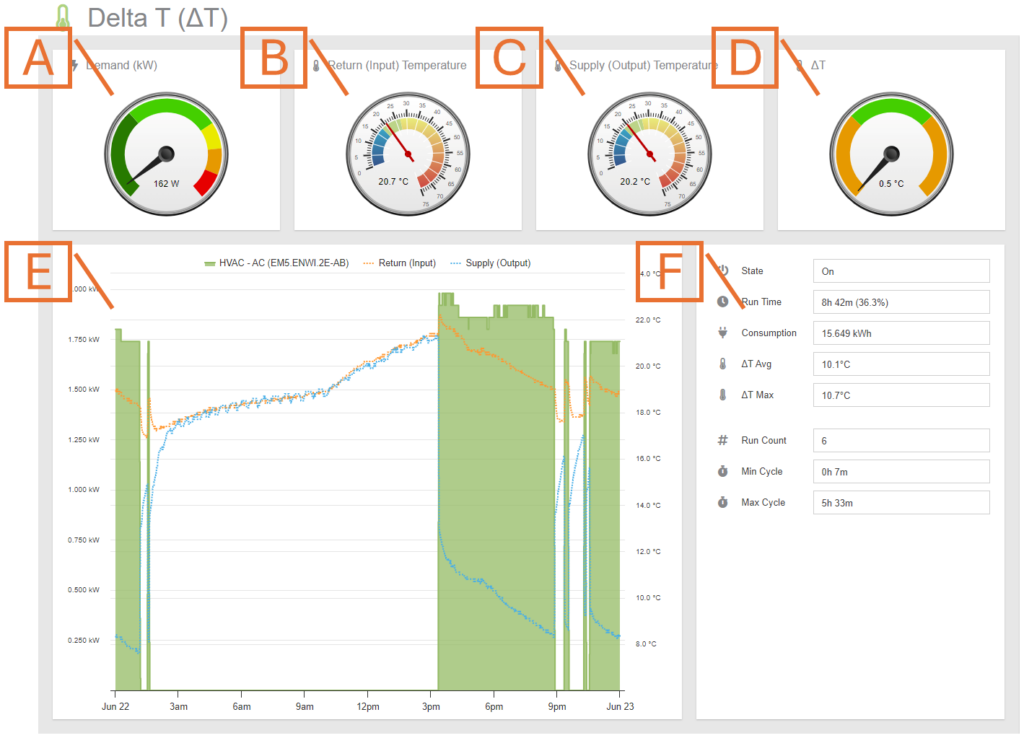
The MyEyedro Delta T plugin can be used to monitor and evaluate health of your heating or cooling system(s). Delta T (or ΔT) is a crucial factor in determining the performance and energy efficiency of an HVAC system as a whole. A measurement outside of normal conditions, either too high or too low, can be a sign of required maintenance or even an early indicator of pending failure.
To use this plugin, you must have at least one Eyedro Electricity Monitor installed on an HVAC system’s (branch circuit) AND at least one Eyedro Temperature Monitor installed to monitor return air and supply air temperatures.
The Delta T plugin is only available to users with a MyEyedro Professional license. .
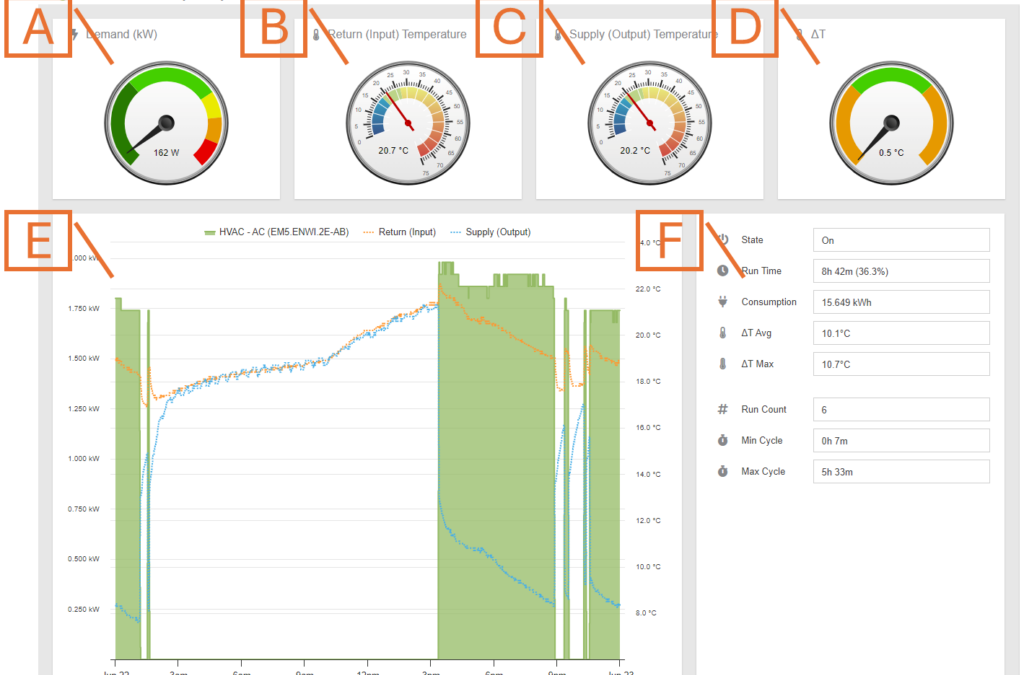
- Demand Gauge. Displays the most recent electricity demand measured for the system (in kW).
- Return Temperature. Displays the most recent temperature for the return (input) side of the heating or cooling system.
- Supply Temperature. Displays the most recent temperature for the supply (output) side of the heating or cooling system.
- Delta T Gauge. Displays the most recent ΔT measurement. During normal operation, you want the needle pointing in the green area. NOTE: when the system is off/idle, the needle will not be present.
- Details Graph. A detailed graph showing energy demand and temperature overlay for the selected period.
- System Metrics. Various metrics computed for the selected period:
- State: Current state of the system. Either “ON” or “Idle”.
- Run Time: Total amount of time the system has been “ON” during the period.
- Consumption: Total amount of electricity consumed during the period.
- ΔT Avg: Average ΔT observed during “ON” cycles.
- ΔT Max: Maximum ΔT observed during “ON” cycles.
- Run Count: The number of times the system has been “ON”.
- Min Cycle: The minimum amount of time spent in the “ON” state during the period.
- Max Cycle: The maximum amount of time spent in the “ON” state during the period.
Delta T Plugin Tools and Options
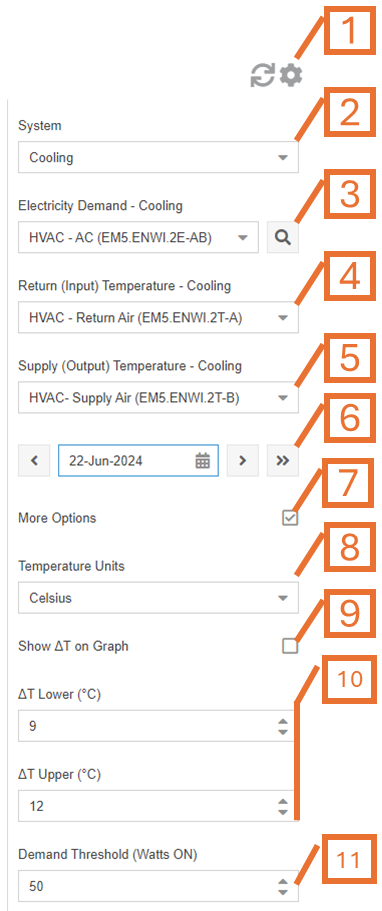
- Plugin Tools:
- Refresh. Update the data and visuals on screen.
- Options. Expand or collapse the options menu.
- Select the Mode. This can be either heating or cooling.
- Select which Display Group to use for electricity data.
- Select which Display Group to use for return (input) temperature.
- Select which Display Group to use for supply (output) temperature.
- Choose the Date for which Delta T data will be analyzed. By default this will be set to the current date.
- Check the More Options checkbox to show additional options
- Choose temperature display Units.
- Check to show ΔT series on the Graph. Unchecking this option will show return and supply temperature data separately.
- Expected ΔT limits. NOTE: These are differential temperature values not absolute temperatures.
- Demand Threshold used to determine when the heating or cooling system is considered ‘ON‘