Compare
The MyEyedro Compare plugin can be used to compare or perform simple math on data from up to two different display groups. The Compare screen provides:
- Dynamic Performance Benchmarking: Side-by-side Comparison Graphs allow you to visualize consumption data across different display groups, making it easy to spot efficiencies or outliers across your entire operation.
- Post Event Analysis: Comparing consumption data from before and after a specific event—like a machine overhaul or installing a high-efficiency motor—is the best way to prove ROI and identify hidden operational issues.
- Advanced Mathematical Insights: Go beyond simple viewing with Integrated Math Operations that automatically calculate and graph the relationship between data sets, providing instant statistical results for any selected period.

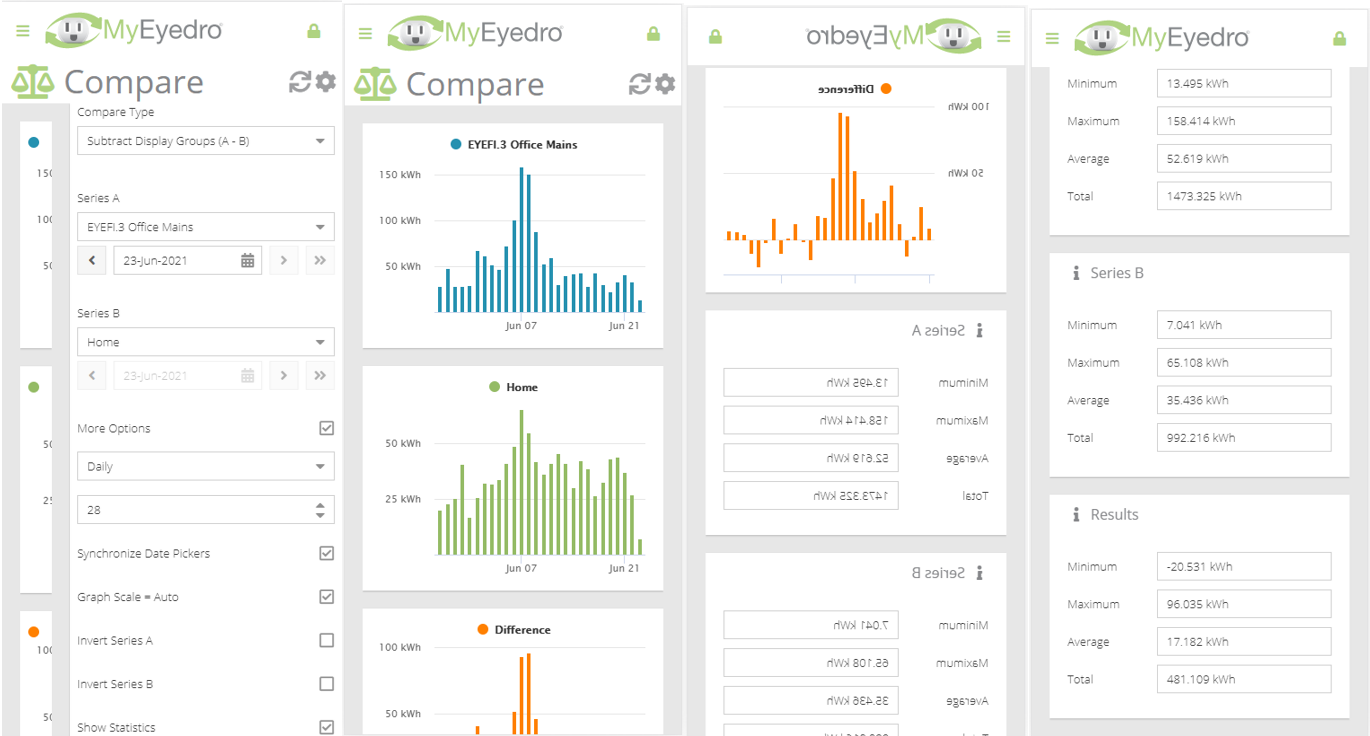
- Comparison Graphs. Displays consumption data for the selected period of the Display Groups to compare. For math operations, a third graph is shown at the bottom with the results of the operation.
- Statistics and Results. Displays statistics for the individual display groups and the results of the selected operation. Statistics for each series are based on the period of time selected.
Compare Plugin Tools and Options
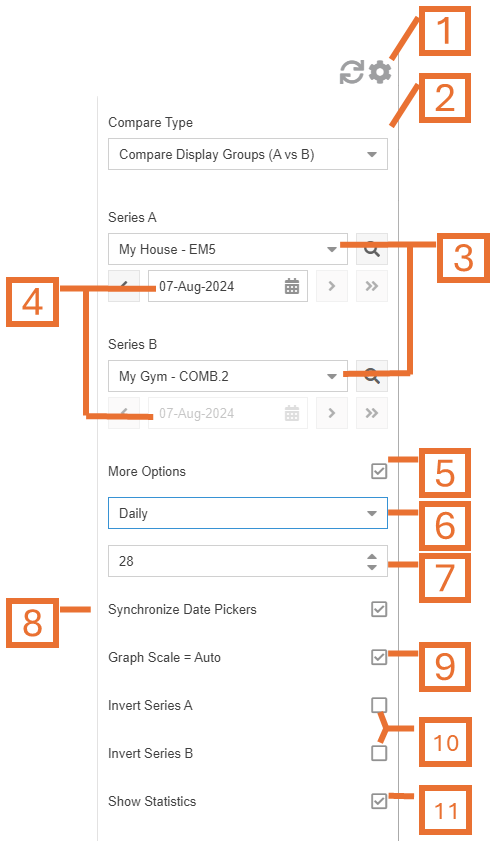
- Plugin Tools:
- Refresh. Update the data and visuals on screen.
- Options. Expand or collapse the options menu.
- Select the operation to be performed.
- Select which Display Groups to evaluate for each series. NOTE: Only display groups comprised of electricity, gas or water monitoring devices are available in this plugin.
- Choose the date for which operation will be performed. By default this will be set to the current date. NOTE: If the Synchronize Date Pickers option is checked, the date fields for Series B will be unavailable.
- Check the More Options checkbox to show additional options.
- Choose the Scale used for the data. This can be; hourly, daily, weekly or monthly.
- Choose the Number of Steps (in the x-axis) shown in each of the Comparison Graphs.
- Check Synchronize Date Pickers to force the date fields for both series to use the same values.
- Graph Scale. Unchecking will allow the user to enter Graph Min, and Graph Max values.
- Invert Series. Inverts the data for the specified series if desired.
- Check Show Statistics to display the Statistics and Results region. Uncheck to hide.
Comparing Two Display Groups
The Compare plugin can be configured to compare between two different Display Groups. This is handy when you want to compare consumption between multiple buildings or circuits being monitored.

- Select Compare Display Groups (A vs B) option from the Compare Type field.
- Specify the Display Groups for series A and series B by selecting the appropriate entries from the dropdown menus.
- Choose the date for which electrical consumption or cost data is displayed. By default this will be set to the current date. NOTE: If the Synchronize Date Pickers option is checked, the date fields for Series B will be unavailable.
- Check the More Options checkbox to show additional options if desired.
- Optionally, choose the Scale used for the data. This can be; hourly, daily, weekly or monthly.
- Optionally, choose the Number of Steps (in the x-axis) shown in each of the Comparison Graphs.
- Optionally, specify any additional options to achieve your desired outcome.
Before and After Comparison
The Compare plugin can be configured to compare before and after for a single Display Group. This is handy when you want to compare consumption before and after a specific event, such as cleaning a furnace filter, or compare current data with historical data, such as this time last year/month etc.

- Select Compare Display Groups (A vs B) option from the Compare Type field.
- Specify the same Display Group for both series A and series B.
- If not already showing, check the More Options checkbox to show additional options.
- Ensure the Synchronize Date Pickers option is unchecked.
- Choose the desired date for Series A.
- Choose the desired date for Series B.
- Optionally, choose the Scale used for the data. This can be; hourly, daily, weekly or monthly.
- Optionally, choose the Number of Steps (in the x-axis) shown in each of the Comparison Graphs.
- Optionally, specify any additional options to achieve your desired outcome.
Adding or Subtracting Two Display Groups
The Compare plugin can also be configured to perform math operations (addition or subtraction) between two different Display Groups.

- Select Add Display Groups (A + B) option from the Compare Type field. Alternatively, choose the subtract option.
- Specify the Display Groups for series A and series B by selecting the appropriate entries from the dropdown menus.
- Choose the date for which electrical consumption or cost data is displayed. By default this will be set to the current date. NOTE: If the Synchronize Date Pickers option is checked, the date fields for Series B will be unavailable.
- Check the More Options checkbox to show additional options if desired.
- Optionally, choose the Scale used for the data. This can be; hourly, daily, weekly or monthly.
- Optionally, choose the Number of Steps (in the x-axis) shown in each of the Comparison Graphs.
- Optionally, specify any additional options to achieve your desired outcome.
Mobile View