Consumption
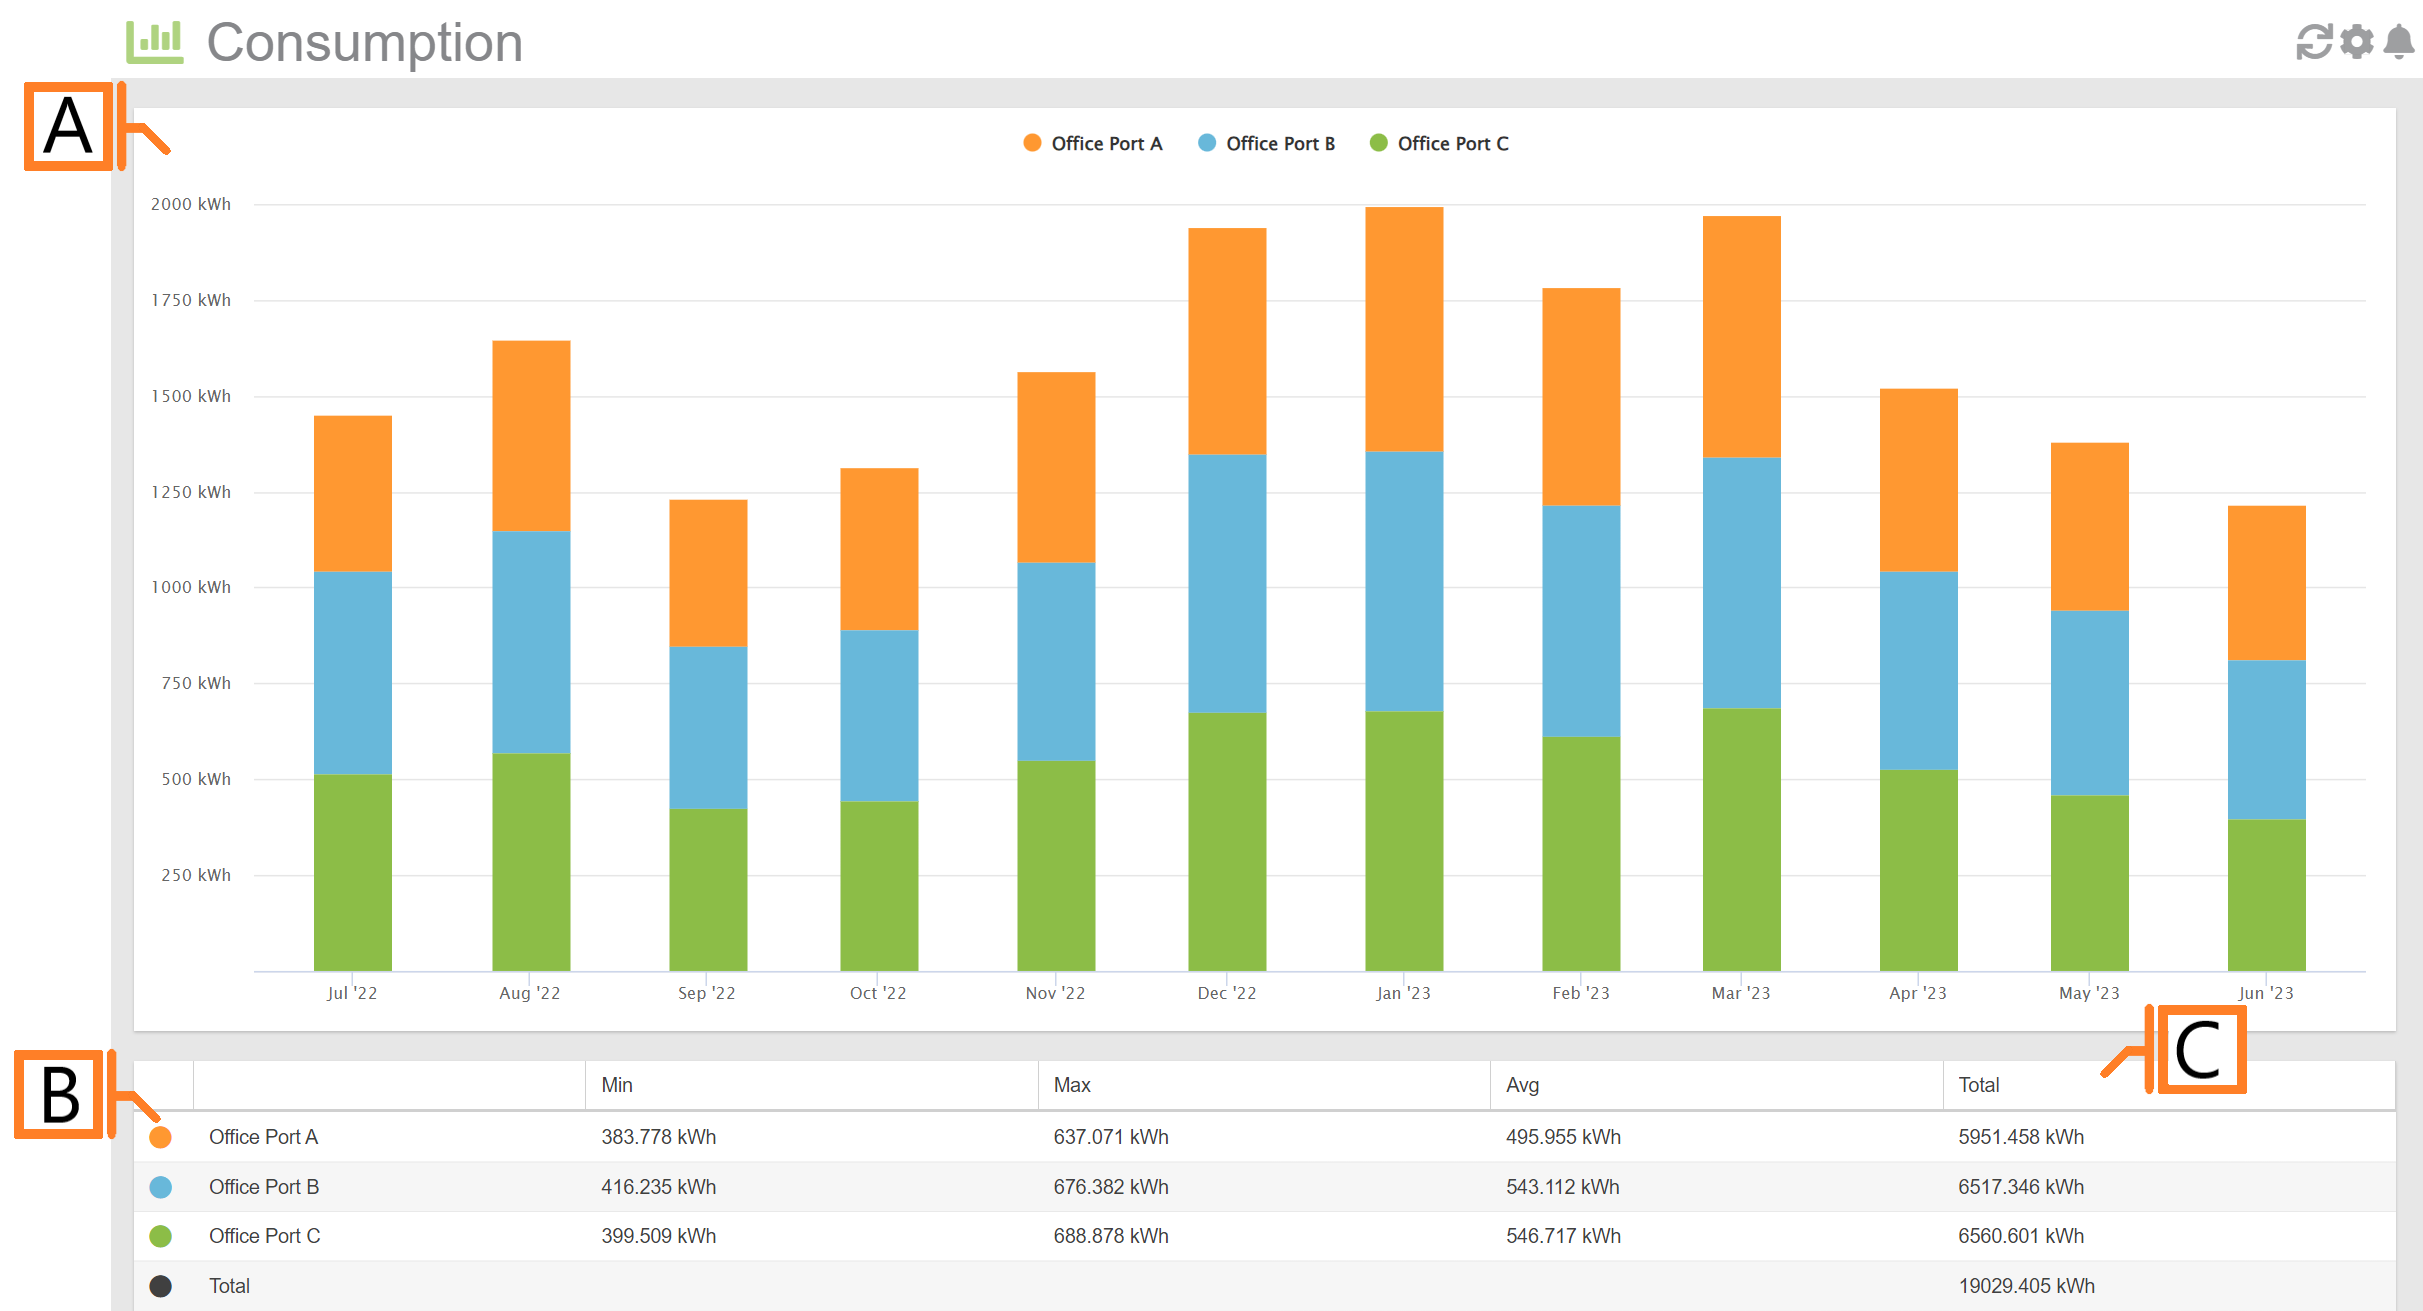
The MyEyedro Consumption plugin displays a graph of hourly, daily, weekly, or monthly consumption or cost data for all sensors of a specified Display Group.
Consumption is a measure of demand over time. For electricity, electrical consumption is measured in kWh and represents the amount of electricity that has been consumed over a period of time. Example: Ten 100W (10 x 0.1kW = 1kW of demand) lamps left on for one hour would equal 1kWh of consumption.
- Consumption Graph. Displays hourly, daily, weekly, or monthly consumption or cost data for all sensors of a specified Display Group.
- Statistics Grid. Functions as a graph legend as well as displaying statistics for the contents of the graph.
- Statistics. Displays basic statistics for data currently displayed.
Consumption Plugin Tools and Options
- Plugin Tools:
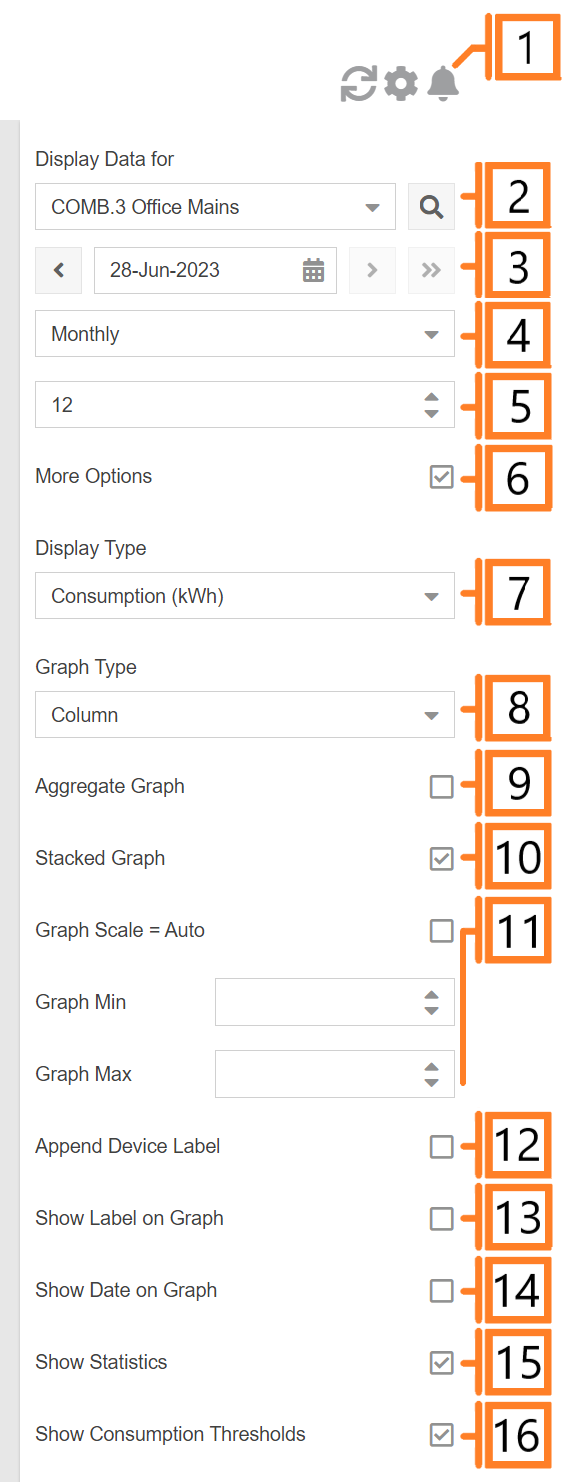
- Refresh. Update the data and visuals on screen.
- Options. Expand or collapse the options menu.
- Alerts. Expand or collapse the alerts region.
- Select which Display Group to evaluate.
- Select the Date for which consumption data is displayed. By default this will be set to the current date.
- Choose the Scale of the consumption data.
- Choose the Number of Steps (in the x-axis) shown in the Consumption Graph.
- Check the More Options checkbox to show additional options.
- Specify whether the graph series displays Consumption (kWh) or Cost ($) information.
- The Graph Type will change what style of graph is used to display the data.
- Check Aggregate Graph to sum all sensors, of the selected display group, into a single value. Uncheck to display the individual sensors in the graph.
- Specify whether values each sensor will be stacked on top of each other or displayed side-by-side.
- Graph Scale. Unchecking will allow the user to enter Graph Min, and Graph Max values.
- Check Append Device Label to show device label for each sensor. Uncheck to hide. This option is not available when Aggregate Graph is checked. NOTE: Useful when display groups consist of sensors from multiple devices.
- Check Show Label on Graph to show the display group label in the graph heading. Uncheck to hide. This options is not available when the Aggregate Graph option is unchecked.
- Check Show Date on Graph to show the current date in the graph heading. Uncheck to hide.
- Check Show Statistics to display the statistics region of the plugin. Uncheck to hide.
- Check Show Consumption Thresholds to overlay consumption alert threshold settings on the Summary Graph. NOTE: Consumption alerts require a MyEyedro Pro license.
Available Alerts
Consumption alerts require a MyEyedro Pro license. NOTE: When creating consumption alerts for a display group, all devices within the display group must have an active MyEyedro Pro license.
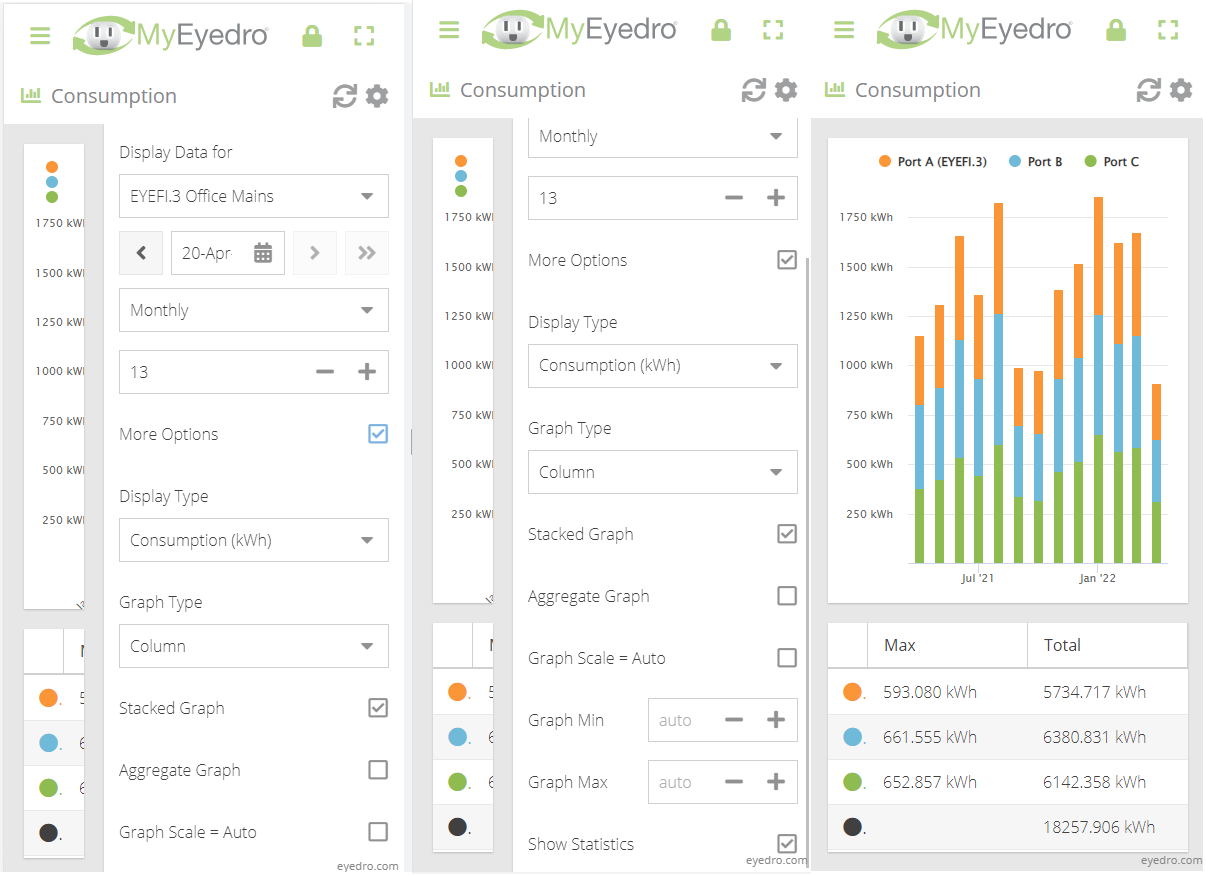
Mobile View


