Demand | MyEyedro User Guide
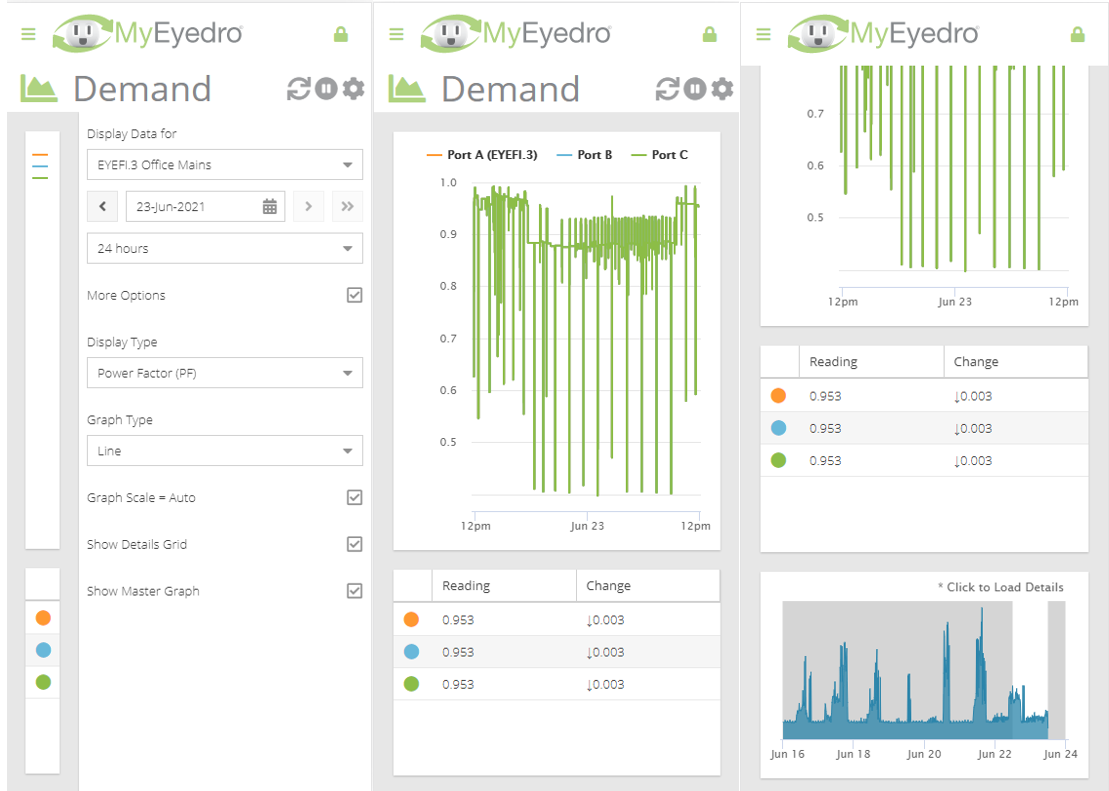
The MyEyedro Demand plugin displays current and historical demand data for all sensors of a specified Display Group. The Demand view provides:
- Precision Deep-Dives: Explore your energy history with a Detailed Timeline Graph that lets you highlight and zoom into specific regions for granular, sensor-level analysis.
- Centralized Insights Grid: Instantly identify trends with a Details Grid that acts as both a visual legend and a real-time scoreboard for your latest sensor readings and value changes.
- Seamless Historical Navigation: Use the Master Timeline to scan a full week of aggregate data, then simply click any point of interest to instantly populate the detailed view for a closer look.
Demand is the momentary rate at which something is used. For electricity, electrical demand is measured in kW and represents the rate at which electricity is consumed. Example: Turning on ten 100W (0.1kW) lamps would equal 1kW of demand. For volumetric monitors (water/gas), demand is measured in units/minute, where units are defined based on the type of meter connected to. Example: Water from a bib could be flowing at a rate of 1 gallon/minute.

- Detailed Timeline Graph. Shows real-time or historical demand data for all sensors of a selected Display Group. You can use your mouse to highlight regions of the graph to zoom in on.
- Details Grid. Functions as a graph legend as well as displaying the most recent readings and last change in value for all sensors.
- Master Timeline Graph. Shows the aggregate data for the past week. You can use your mouse to click on an area of interest to display the details in the Detailed Timeline Graph.
Demand Plugin Tools and Options

- Plugin Tools:
- Refresh. Update the data and visuals on screen.
- Pause. Pause live updates. NOTE: When selecting historical data, either from the date picker or from the Master Timeline Graph, the data updates will automatically be paused.
- Play (not shown). Resume live updates. NOTE: If viewing historical data, clicking the Play button will automatically set the date picker to today and resume live updates.
- Options. Expand or collapse the options menu.
- Alerts. Expand or collapse the alerts region.
- Select which Display Group to evaluate. NOTE: Only display groups comprised of devices with real-time data (electricity, temperature, pulse, etc.) collection are available in this plugin.
- Select the Date for which demand data is displayed. Changing this value will adjust the right most (end) date of the Master Timeline Graph. By default this will be set to the current date.
- Choose the Scale of the demand data. This option will also adjust the size of the selection window in the Master Timeline Graph.
- Check the More Options checkbox to show additional options.
- Specify the Display Type display. NOTE: Display Type is dependent on the type of device(s) in the selected display group.
- Electricity
- Power in kilowatts (kW)
- Current in amperes (A)
- Voltage in volts (V)
- Power factor
- Gas or Water
- Flow in units per minute (x/min) – units specified in display group settings
- Pulses counted
- Temperature
- Temperature in Celsius (°C)
- Temperature in Fahrenheit (°F)
- Electricity
- The Graph Type will change what style of graph is used to display the data.
- Check Aggregate Graph to sum all sensors, of the selected display group, into a single value. Uncheck to display the individual sensors in the graph.
- Graph Scale: Unchecking will allow the user to enter Graph Min, and Graph Max values.
- Check Append Device Label to show device label for each sensor. Uncheck to hide. This option is not available when Aggregate Graph is checked. NOTE: Useful when display groups consist of sensors from multiple devices.
- Check Show Label on Graph to show the display group label in the graph heading. Uncheck to hide. This options is not available when the Aggregate Graph option is unchecked.
- Check Show Date on Graph to show the current date in the graph heading. Uncheck to hide.
- Check Show Graph Legend to display the graph legend. Uncheck to hide.
- Check Show Details Grid to display the details grid region of the plugin. Uncheck to hide.
- Check Show Master Graph to display the master graph timeline region of the plugin. Uncheck to hide.
- Check Show Demand Thresholds to overlay demand threshold alert settings on the Detailed Timeline Graph. NOTE: Demand alerts require a MyEyedro Pro license.
- Specify a display group to use as a Temperature Overlay on the Detailed Timeline Graph. NOTE: Requires one or more Eyedro Temperature Monitoring products associated with the user account.
- Temperature Units (not shown) specify the units the temperature overlay is displayed in. NOTE: Requires one or more Eyedro Temperature Monitoring products associated with the user account.
Alerts Tool Panel
Demand Alert Configurations
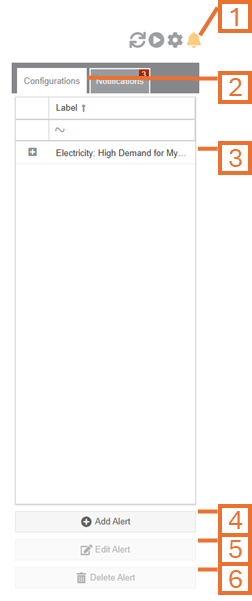
The Alert Configurations Panel, in the Demand plugin, provides a convenient way to create, edit and delete alert configurations for the selected display group.
IMPORTANT: all devices within the selected display group must have an active MyEyedro Pro license for this functionality to be enabled
- Alerts Tool button. Click this button to show/hide the Alerts panel.
- NOTE: The tool button will flash orange if there are any notifications within the displayed data window.
- Alerts Configuration tab. Click this tab to show any demand alerts for the selected display group.
- List of existing consumption alerts.
- NOTE: by clicking on the “+” beside the item, a brief description of the alert configuration is displayed.
- Use this button to create new demand alert configuration for the selected display group.
- Use this button to edit the selected alert configuration.
- Use this button to delete the selected alert configuration.
NOTE: Alert add, edit and delete functionality is described in the Display Group Alerts article.
Demand Alert Notifications
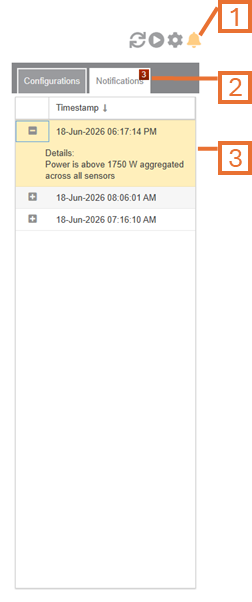
The Alert Notifications Panel, in the Demand plugin, provides a convenient way to alert notifications for the selected display group.
IMPORTANT: all devices within the selected display group must have an active MyEyedro Pro license for this functionality to be enabled
- Alerts Tool button. Click this button to show/hide the Alerts panel.
- NOTE: The tool button will flash orange if there are any notifications within the displayed data window.
- Alerts Notification tab. Click this to show any notifications that occurred within the window of time displayed in the demand graph.
- NOTE: A badge containing the number of notifications is displayed on the tab.
- List of existing consumption alert notifications.
- NOTE: by clicking on the “+” beside the item, a brief description of the alert configuration that triggered the notification is displayed.
- NOTE: The selected notification is also displayed with a vertical line overlay on the demand graph.
Available Alerts
Demand alerts require a MyEyedro Pro license. NOTE: When creating demand alerts for a display group, all devices within the display group must have an active MyEyedro Pro license.
- Demand Alerts – Instantaneous Demand
- Demand Alerts – Average Demand
- Demand Alerts – Continuous Demand
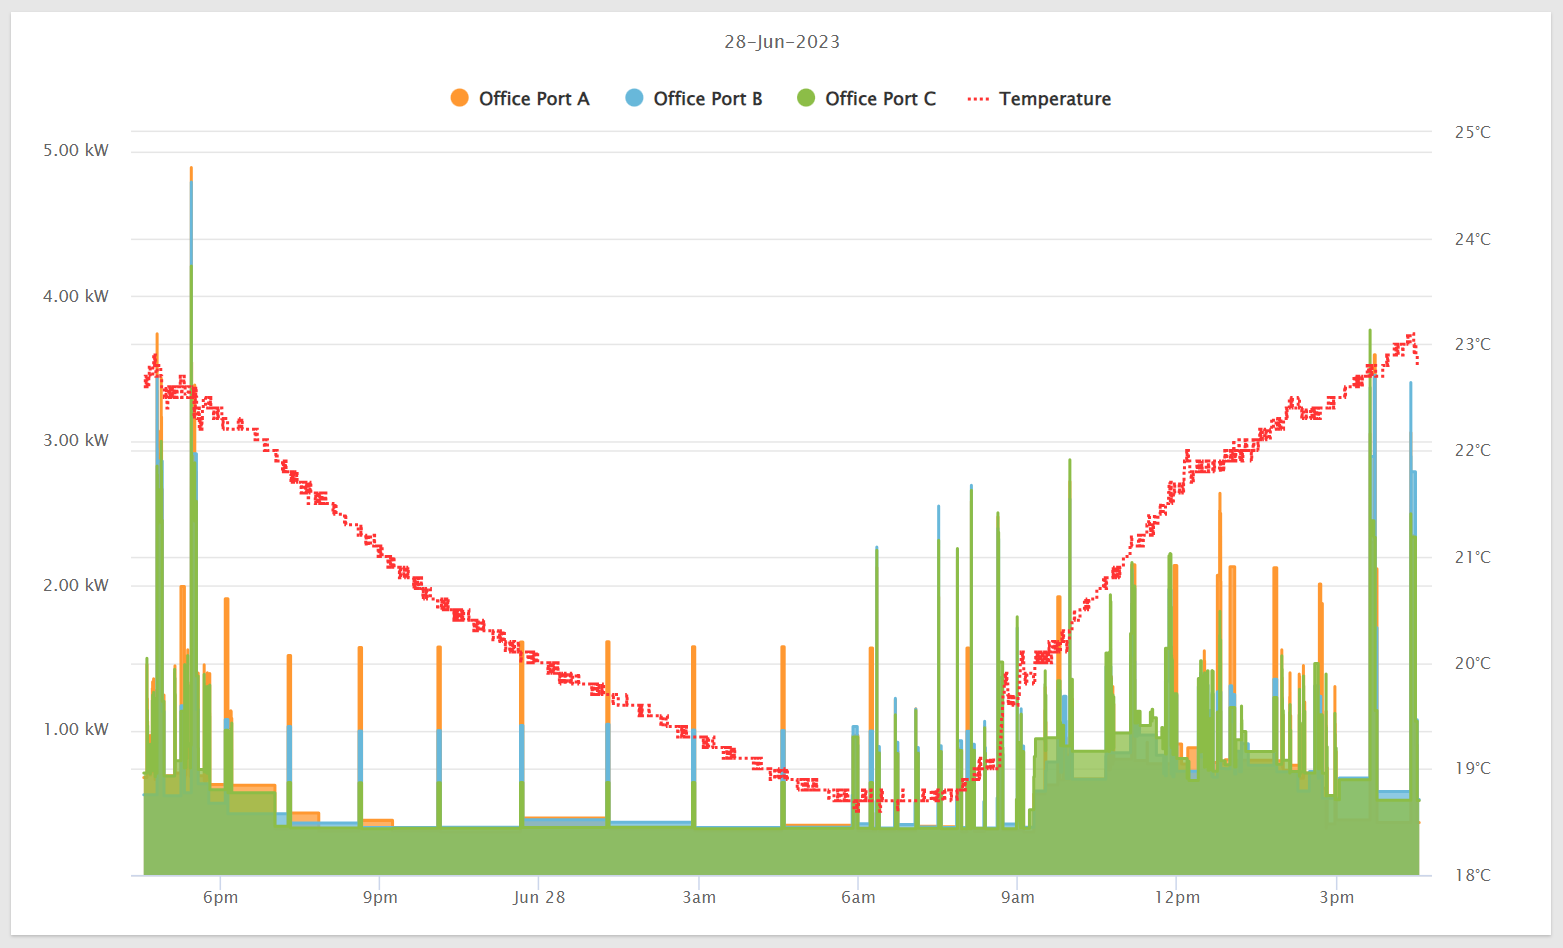
Temperature Overlay
Temperature overlay requires you have at least one Eyedro Temperature Monitoring device associated with your user account. If available and selected, temperature data can be overlaid on the demand data displayed within the Detailed Timeline Graph.
Mobile Screenshots