
How to Use the Live Demand Plugin
Purpose:
To explain how to use the Live Demand plugin. As the name suggests, Live Demand shows what a given Display Group is measuring right now.

Instructions:
- Click on the icon in the lower left corner of the MyEyedro page (this is the Plugin Menu). Select Live Demand.
- Select the Display Group you wish to view from the dropdown menu.
- Select the time interval you wish to view from the dropdown menu.
- You can view historical data using the date picker.
- Or by clicking on the aggregate graph.
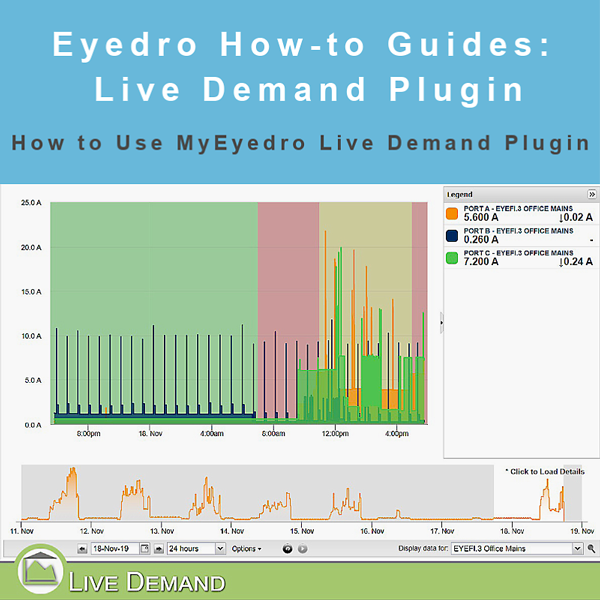
- The legend can be collapsed to view the graph in more detail.
- The graph shows each sensor as a unique color, with the vertical scale being set by the highest measured Wattage reading of all shown sensors.
- Hover the mouse over a sensor’s color in the graph to temporarily cause the other colors to dim and give more detailed information about that sensor’s readings.
- Click and drag on the graph to zoom in on data for a closer look.
- Click the sensors in the legend to turn them on or off in the graph.
- The Legend displays the measured data of each sensor in a Display Group. Each sensor is represented by a color that is reflected in the main graph when individual sensors are displayed. If Aggregate is selected from the Options menu, then only one color will be displayed.
- The button next to Options refreshes the data.
- In the Options menu you can set data to display as Power (in Watts), Current (in Amps), Voltage (V), or Power Factor (PF).
- In Options you can also turn the following on or off: Area Graph (whether or not the graph shows a line or is filled in below it), Time-of-Use bands (TOU rate setting only), Show Aggregate (whether or not the graph displays multiple sensors or all sensors in a display group as a single unit), Device Name in Legend (whether or not the Eyedro device’s name, set in Device Settings, is visible in the legend).
- You can select either Auto graph scale or specify a Min and Max scale. See Customizing Live Demand for more details.


