Asset Metrics
The Asset Metrics report type provides detailed run-state analysis and accompanying metrics.
The Asset Metrics report is only available to users with a MyEyedro Professional license.
Report profiles can be created and modified in the MyEyedro Report Configuration plugin and all generated reports can be viewed in the MyEyedro Report Viewer plugin.
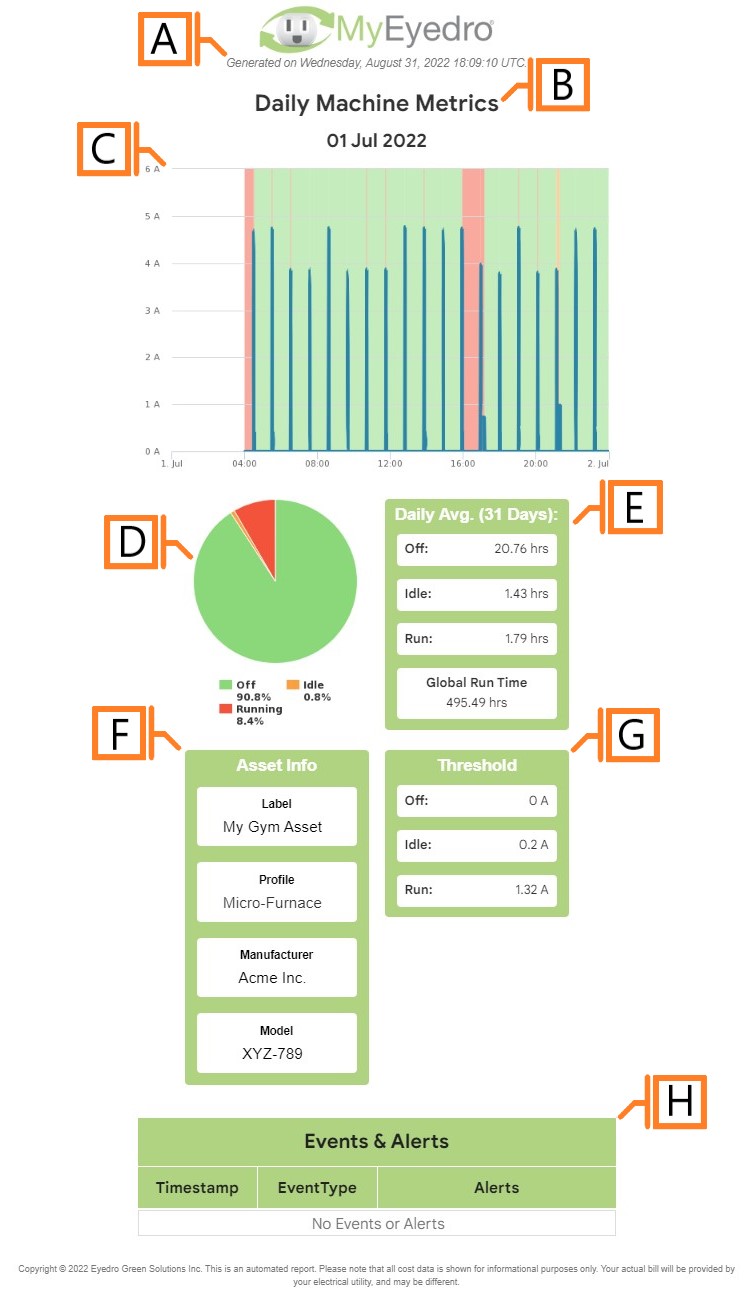
- Generation Date. The date and time the report was generated.
- Report Title. This is a combination of the report title text and report period as defined in the report configuration options.
- Graph. A graph plotting the asset’s amperage draw (blue line) and corresponding run-state (green, orange, and red highlights) over the report period.
- Pie Chart. A pie chart breaking down the percentage of time spent in each run-state over the report period.
- Daily Metrics. Metrics detailing the average duration spent in each run-state over the past 31 days as well as global asset run time (total hours running since Asset creation).
- Asset Info. Asset information such as the user assigned Label, Asset Profile, Manufacturer, and Model Number.
- Run-State Thresholds. The amperage thresholds for each run-state.
- Events and Alerts table. A table listing asset events/alerts that occurred over the report period.
Configuration Options
NOTE: Common report configuration options are not shown:
- Report Type. Specify the type of report to generate. Choose Asset Metrics.
- Report Grouping. NOTE: Asset Metrics reports only support Assets.
- Report Period. The time frame which the Report will evaluate. Choose one of Daily or Weekly.
- Report Title. Used to easily identify what this Report Profile is being used for.
- Scheduled. Automatically generates a report on the scheduled start day and each period there after.
- Effective Date. The first date your report is scheduled to run. NOTE: this option is only visible for scheduled reports.
- Email Recipients. The Email addresses you wish a copy of the scheduled report to automatically be sent to. NOTE: this option is only visible for scheduled reports.

