Bills
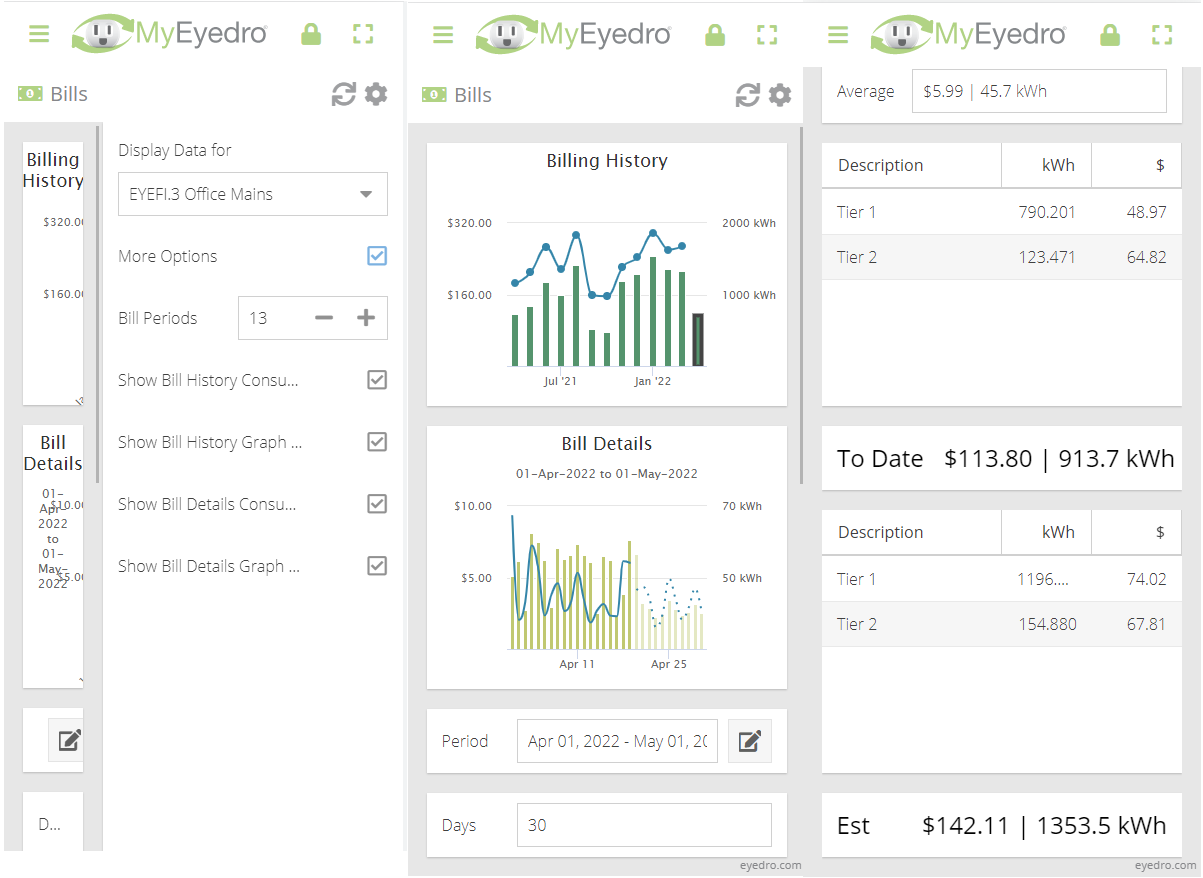
The MyEyedro Bills plugin displays summaries of estimated costs and billing information for all sensors of a specified Display Group. Estimated costs are based on consumption data collected and rate configuration applied.

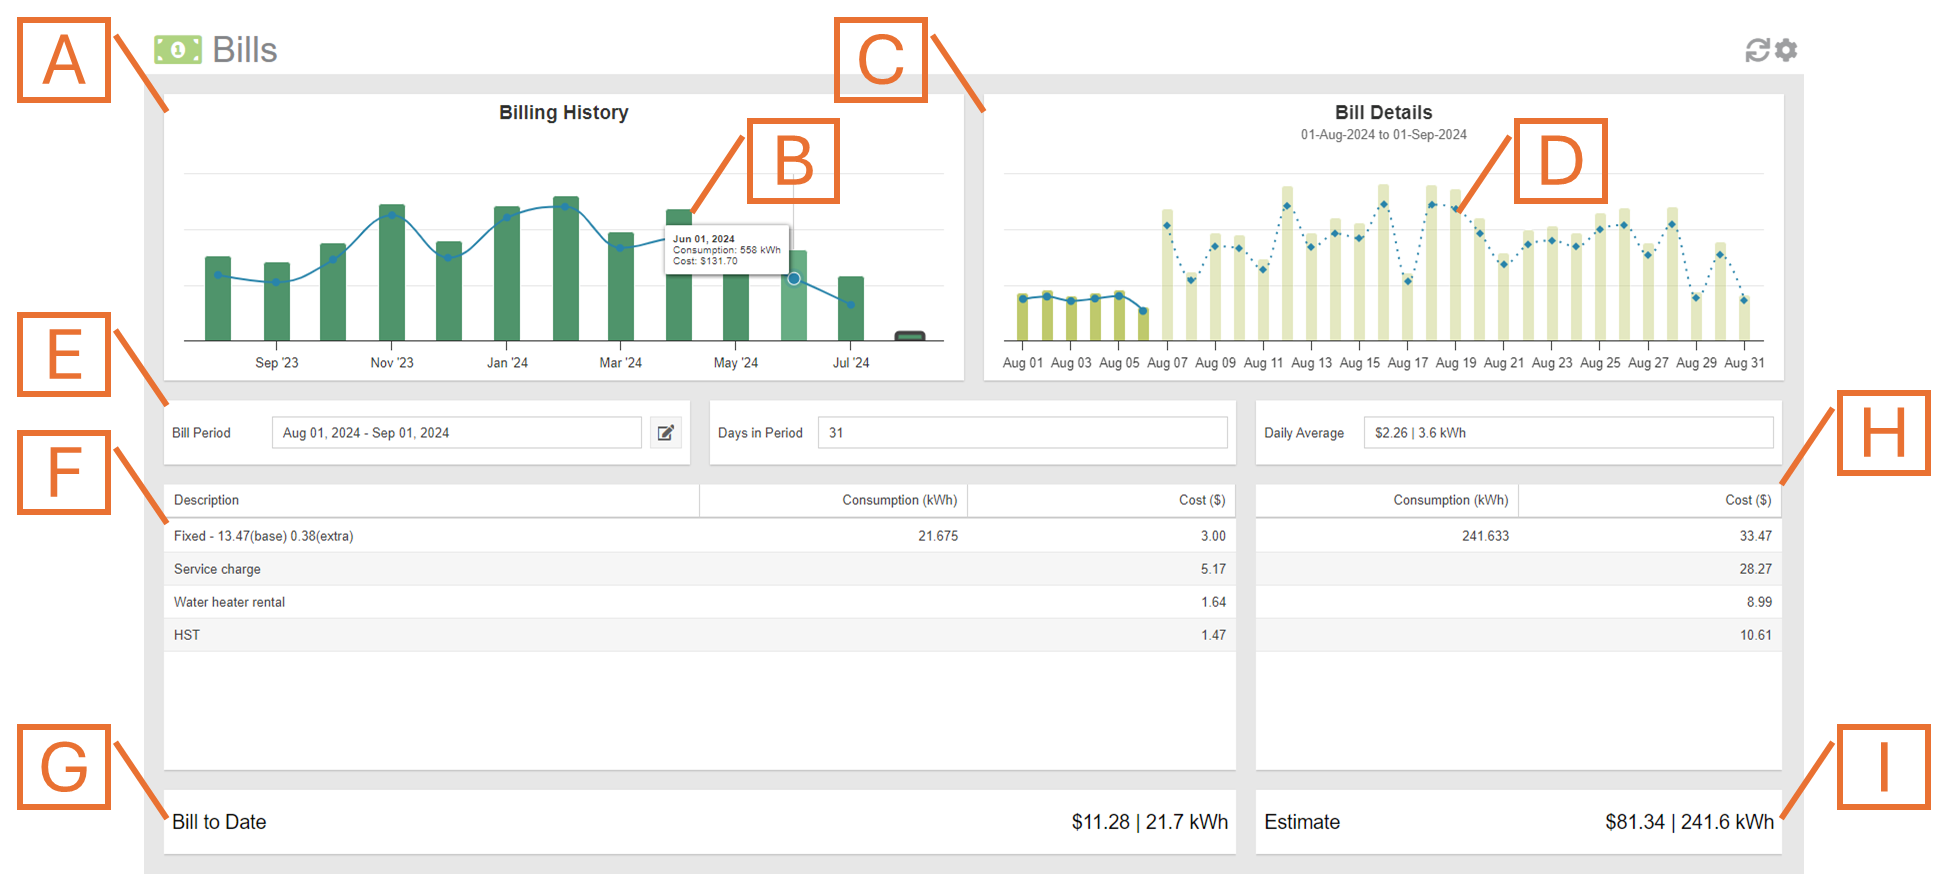
- Billing History Graph. Displays total cost and consumption of the last several billing periods.
- Billing Period. Click on a specific Billing Period in the Billing History Graph to retrieve details for that particular period.
- Bill Details Graph. Displays cost and consumption information for each day in the selected Billing Period. If displaying the current period, this graph displays estimated consumption and cost for any dates in the future. NOTE: Estimates are based on measured and historical consumption.
- Daily Bill Details. Hover over any of the columns to display a tooltip detailing consumption and cost breakdown details for that day.
- Bill Period Statistics. Date range, number of days and average cost and consumption for the selected Billing Period.
- Billing Period Details. Displays consumption and cost breakdown based on rates provided in Rate Settings for the Display Group.
- Billing Period Total. Displays the total consumption and cost for the selected bill period.
- Estimated Bill Details. If viewing the current Billing Period, displays the estimated bill projection for the current period. NOTE: Estimates are based on measured and historical consumption.
- Estimated Bill Total. If viewing the current Billing Period, displays the estimated total bill for the current period. NOTE: Estimates are based on measured and historical consumption.
Bills Plugin Tools and Options

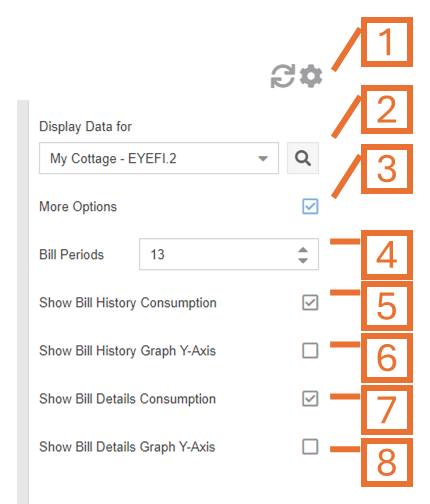
- Plugin Tools:
- Refresh. Update the data and visuals on screen.
- Options. Expand or collapse the options menu.
- Select which Display Group to evaluate. NOTE: Only display groups comprised of electricity monitoring devices are available in this plugin.
- Check the More Options checkbox to show additional options.
- Specify the number of bill periods you want displayed in the Billing History graph.
- Toggles the consumption series (blue line) on the Billing History Graph.
- Toggles the Y-axis labels on the Billing History Graph.
- Toggles the consumption series (blue line) on the Bill Details Graph.
- Toggles the Y-axis labels on the Bill Details Graph.

