Demand
The MyEyedro Demand plugin displays current and historical demand data for all sensors of a specified Display Group.
Demand is the momentary rate at which something is used. For electricity, electrical demand is measured in kW and represents the rate at which electricity is consumed. Example: Turning on ten 100W (0.1kW) lamps would equal 1kW of demand.
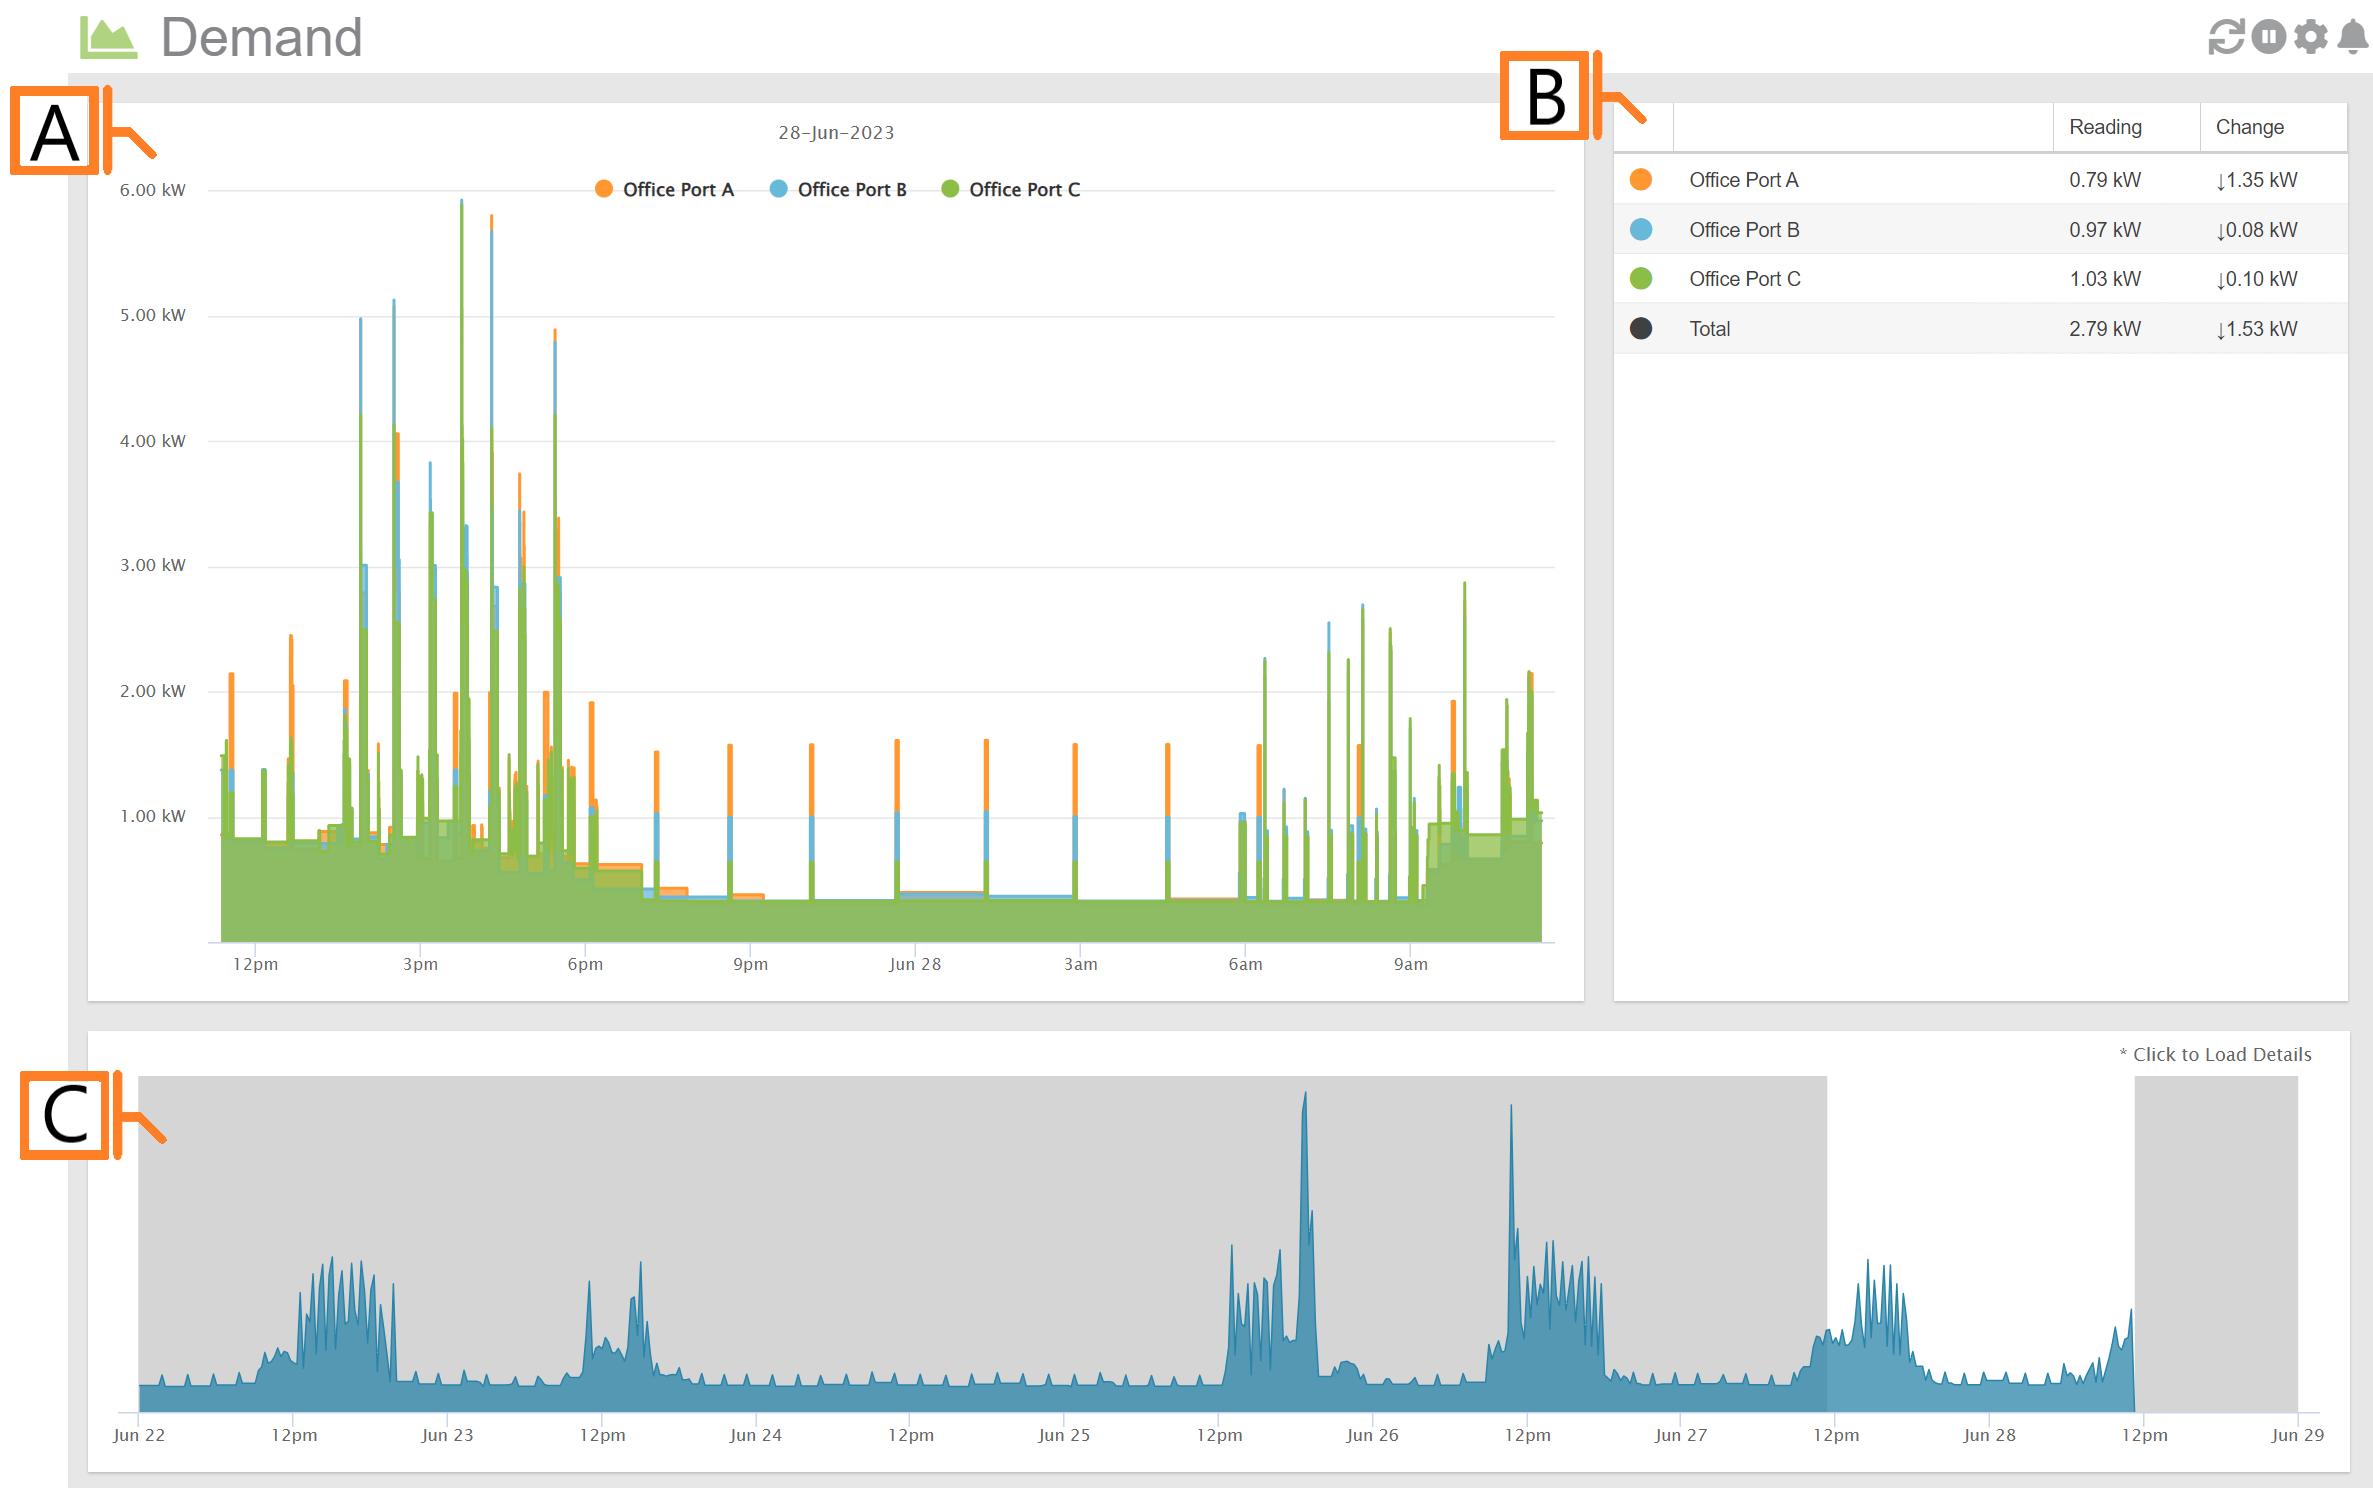
- Detailed Timeline Graph. Shows real-time or historical demand data for all sensors of a selected Display Group. You can use your mouse to highlight regions of the graph to zoom in on.
- Details Grid. Functions as a graph legend as well as displaying the most recent readings and last change in value for all sensors.
- Master Timeline Graph. Shows the aggregate data for the past week. You can use your mouse to click on an area of interest to display the details in the Detailed Timeline Graph.
Demand Plugin Tools and Options
- Plugin Tools:
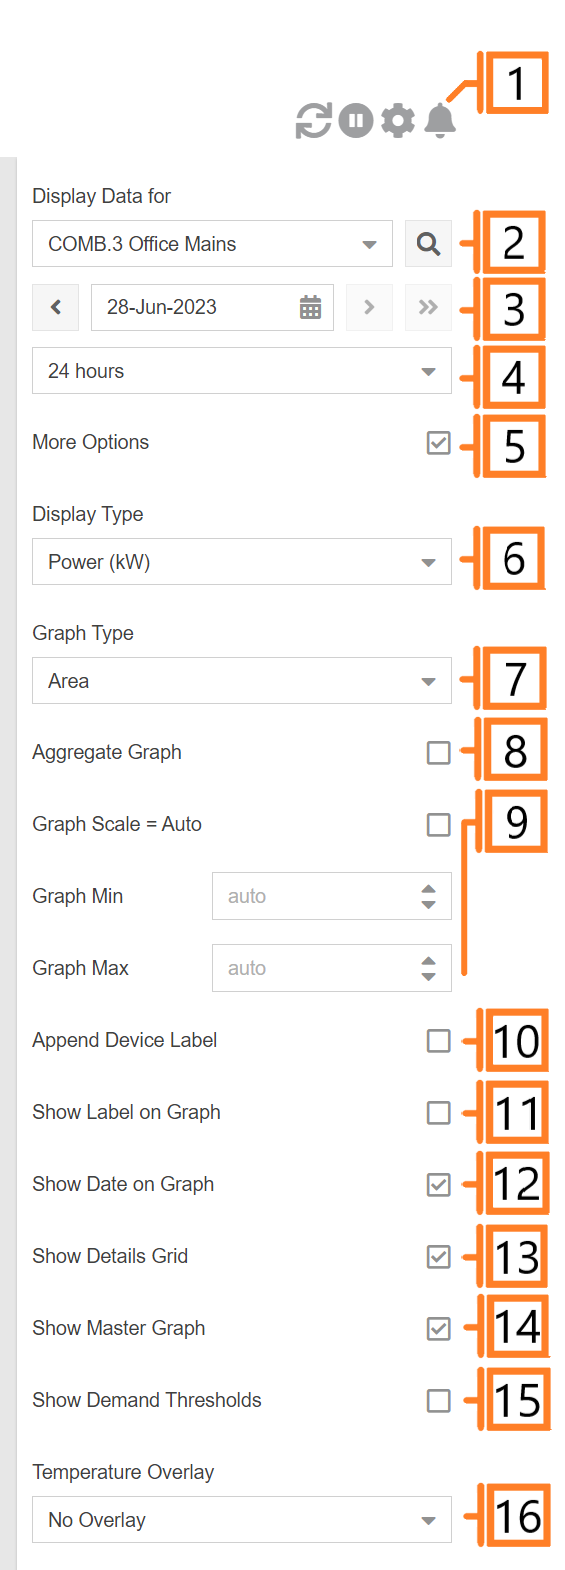
- Refresh. Update the data and visuals on screen.
- Pause. Pause live updates. NOTE: When selecting historical data, either from the date picker or from the Master Timeline Graph, the data updates will automatically be paused.
- Play (not shown). Resume live updates. NOTE: If viewing historical data, clicking the Play button will automatically set the date picker to today and resume live updates.
- Options. Expand or collapse the options menu.
- Alerts. Expand or collapse the alerts region.
- Select which Display Group to evaluate. NOTE: Only display groups comprised of devices with real-time data (electricity, temperature, pulse, etc.) collection are available in this plugin.
- Select the Date for which demand data is displayed. Changing this value will adjust the right most (end) date of the Master Timeline Graph. By default this will be set to the current date.
- Choose the Scale of the demand data. This option will also adjust the size of the selection window in the Master Timeline Graph.
- Check the More Options checkbox to show additional options.
- Specify the Data Type display. NOTE: Display Type is dependent on the type of device(s) in the selected display group.
- The Graph Type will change what style of graph is used to display the data.
- Check Aggregate Graph to sum all sensors, of the selected display group, into a single value. Uncheck to display the individual sensors in the graph.
- Graph Scale: Unchecking will allow the user to enter Graph Min, and Graph Max values.
- Check Append Device Label to show device label for each sensor. Uncheck to hide. This option is not available when Aggregate Graph is checked. NOTE: Useful when display groups consist of sensors from multiple devices.
- Check Show Label on Graph to show the display group label in the graph heading. Uncheck to hide. This options is not available when the Aggregate Graph option is unchecked.
- Check Show Date on Graph to show the current date in the graph heading. Uncheck to hide.
- Check Show Details Grid to display the details grid region of the plugin. Uncheck to hide.
- Check Show Master Graph to display the master graph timeline region of the plugin. Uncheck to hide.
- Check Show Demand Thresholds to overlay demand threshold alert settings on the Detailed Timeline Graph. NOTE: Demand alerts require a MyEyedro Pro license.
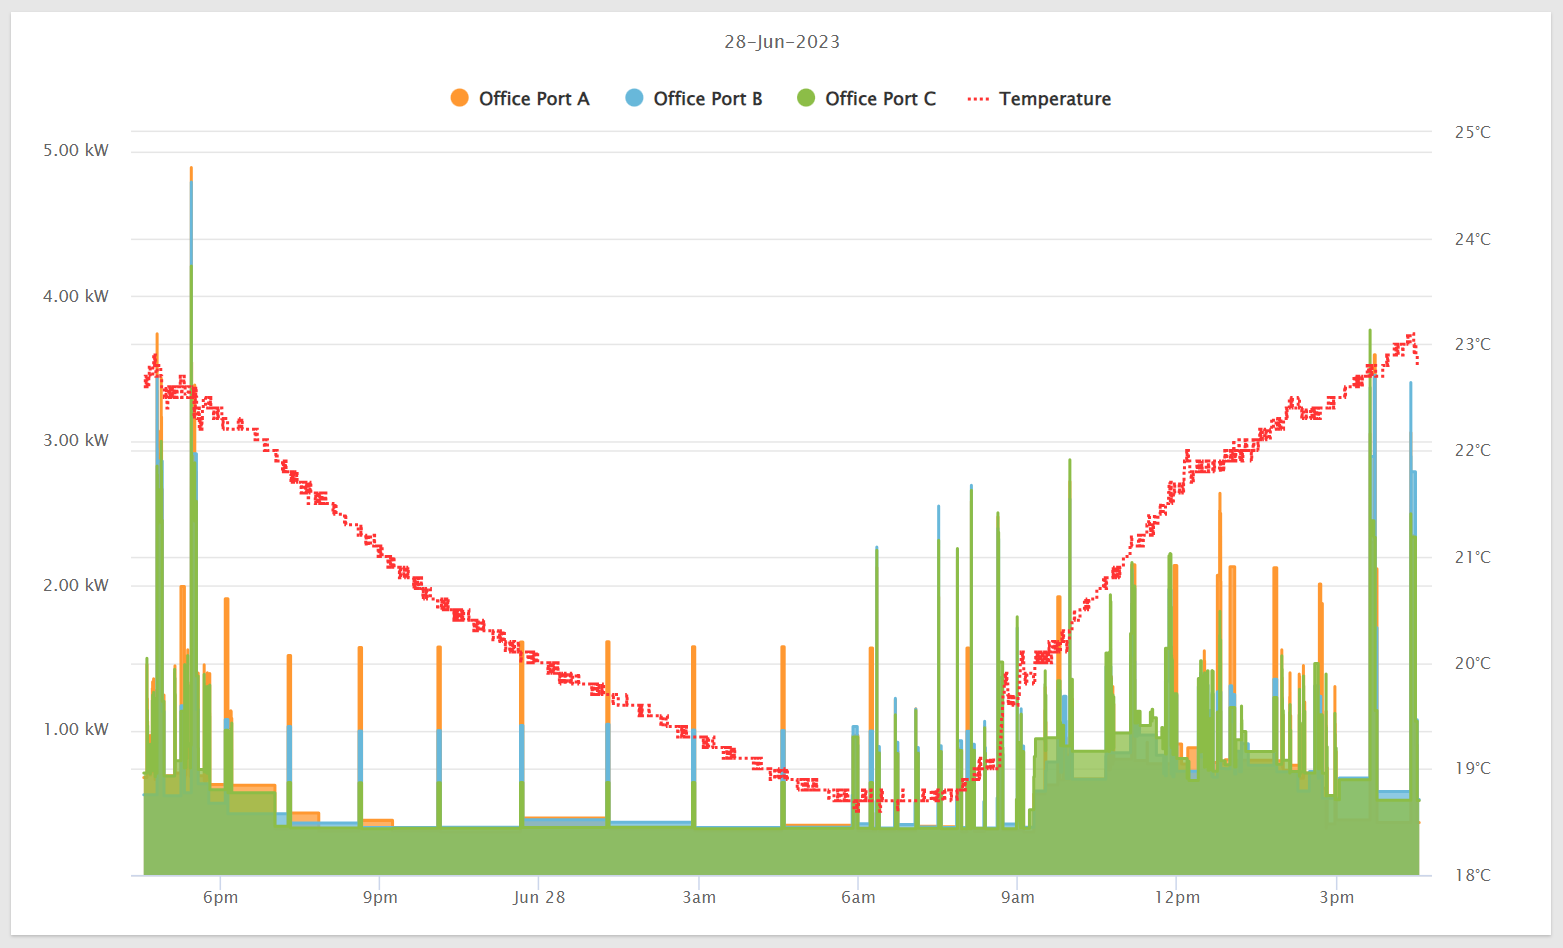
- Specify a display group to use as a Temperature Overlay on the Detailed Timeline Graph. NOTE: Requires one or more Eyedro Temperature Monitoring products associated with the user account.
- Temperature Units (not shown) specify the units the temperature overlay is displayed in. NOTE: Requires one or more Eyedro Temperature Monitoring products associated with the user account.
Available Alerts
Demand alerts require a MyEyedro Pro license. NOTE: When creating demand alerts for a display group, all devices within the display group must have an active MyEyedro Pro license.
- Demand Alerts – Instantaneous Demand
- Demand Alerts – Average Demand
- Demand Alerts – Continuous Demand
Temperature Overlay
Temperature overlay requires you have at least one Eyedro Temperature Monitoring device associated with your user account. If available and selected, temperature data can be overlaid on the demand data displayed within the Detailed Timeline Graph.
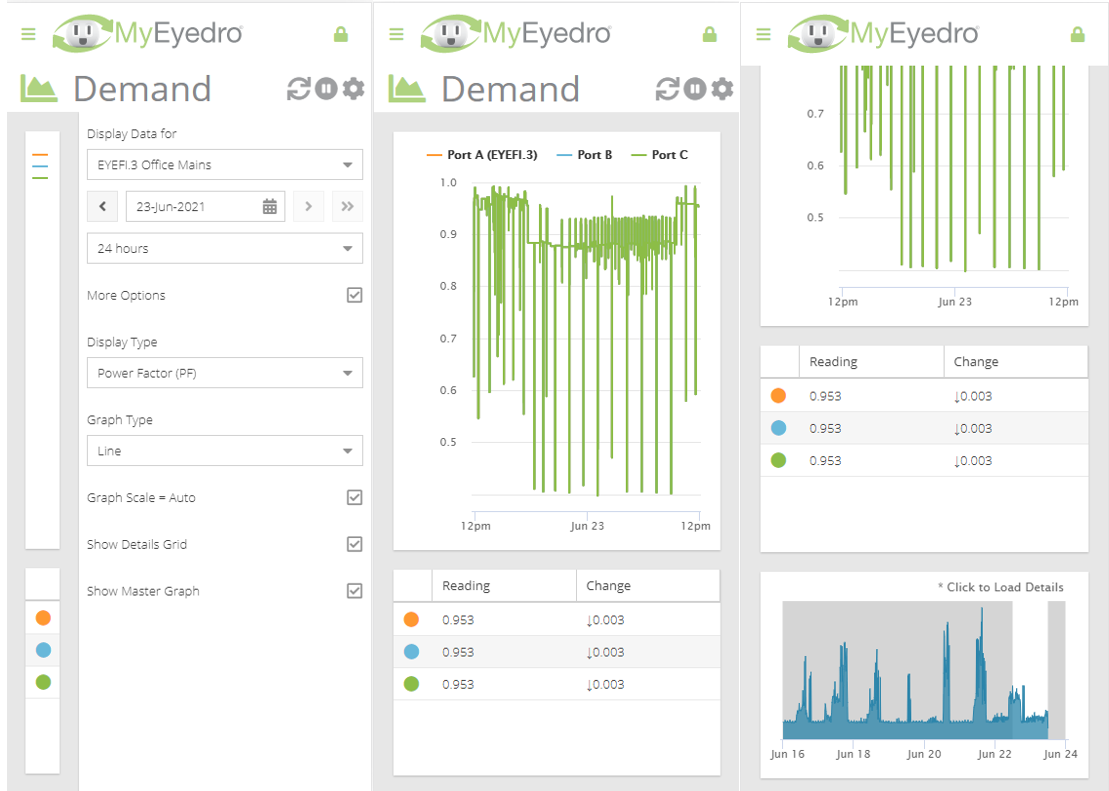
Mobile Screenshots


