Report Viewer
The MyEyedro Report Viewer plugin allows you to view, print and share previously generated reports.
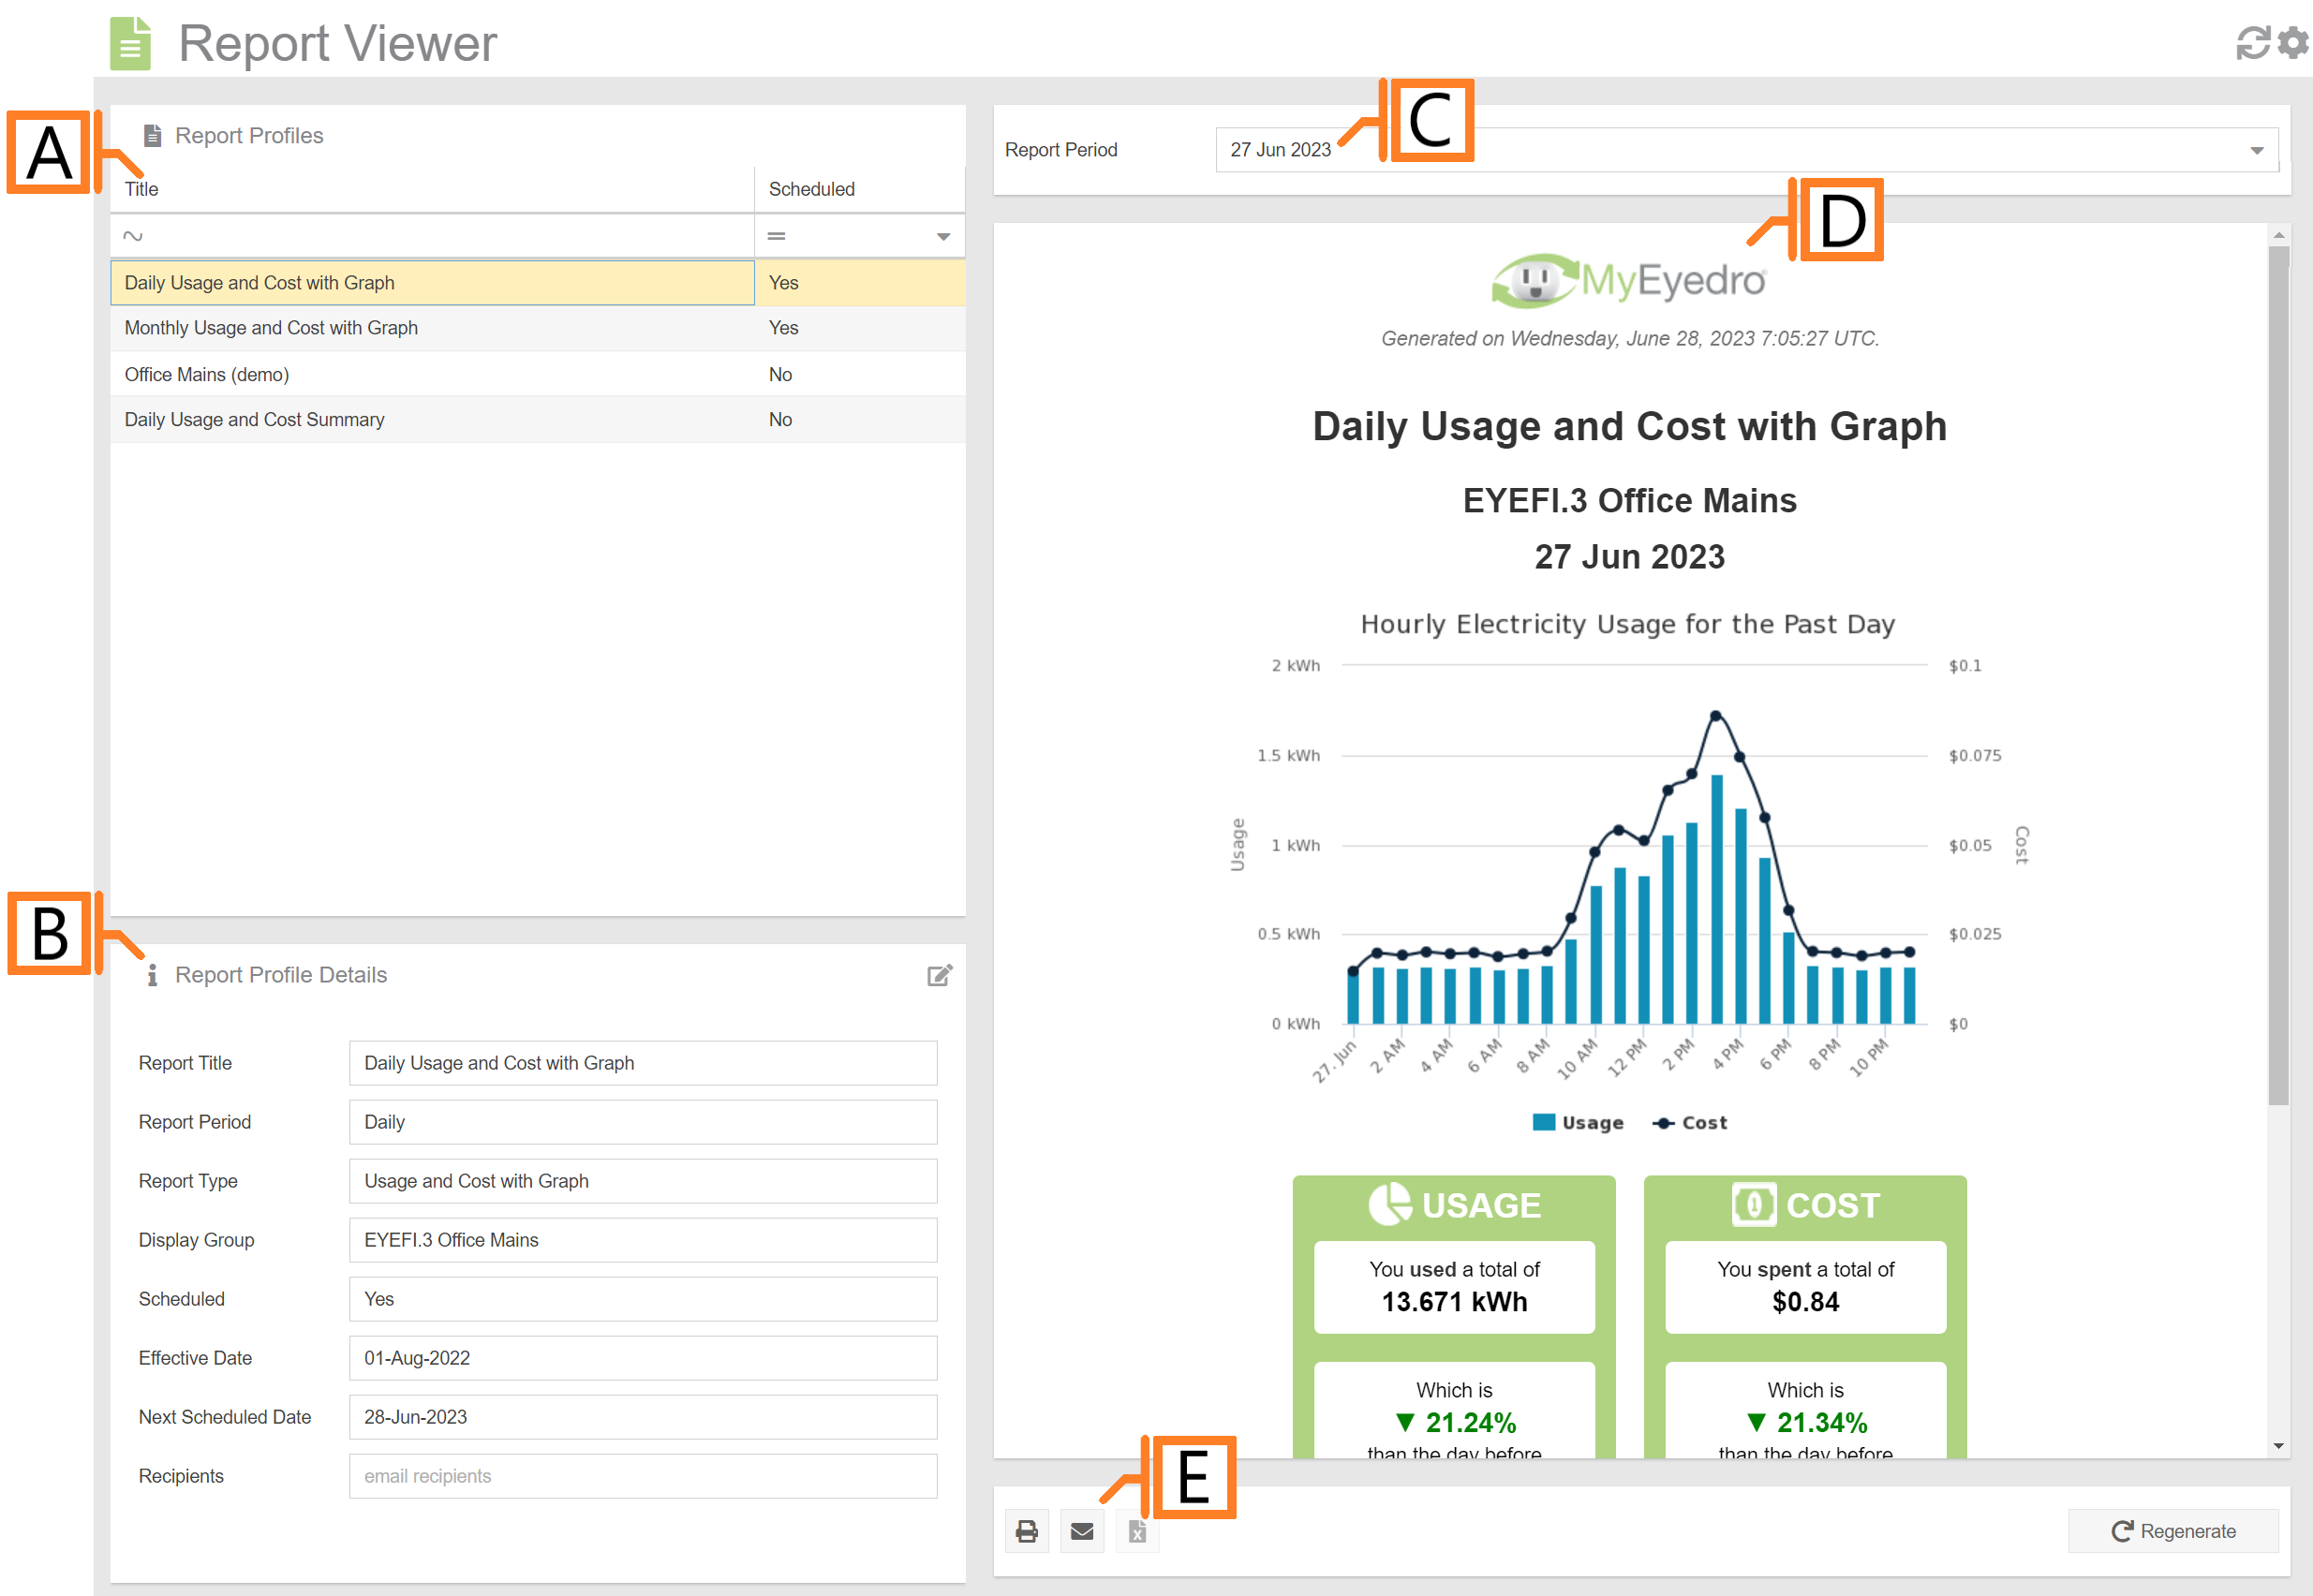
- Report Profiles. List of available report profiles.
- Report Profile Details. Displays the details for the selected report profile. NOTE: clicking on the edit button (top right corner), will redirect you to the Reports configuration plugin.
- Report Period. Choose the desired report to view. For scheduled report profiles, this field will provide a list of available reports. For unscheduled report profiles, there will only be one option in the list.
- Report. Displays the selected report for viewing.
- Additional Report Tools:
- Print. Print the selected report.
- Send (Email). Send the selected report to one or more email recipients.
- Download. Download available data (in .CSV format). NOTE: not all report types have downloadable data.
- Regenerate. Regenerate the report. NOTE: use this function for cases where data may have not been collected when the report was initially generated – i.e. the device’s internet connection was offline.
Report Viewer Plugin Tools and Options
- Plugin Tools:
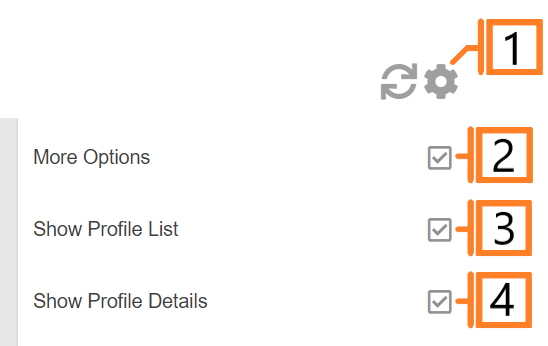
- Refresh. Update the data and visuals on screen.
- Options. Expand or collapse the options menu.
- Check the More Options checkbox to show additional options.
- Check Show Profile List to display the report profiles and details in the plugin region of the report viewer plugin. Uncheck to hide the region.
- Check Show Profile Details to display the report profile details in the plugin region. Uncheck to hide. NOTE: this option is disabled of Show Profile List is unchecked.
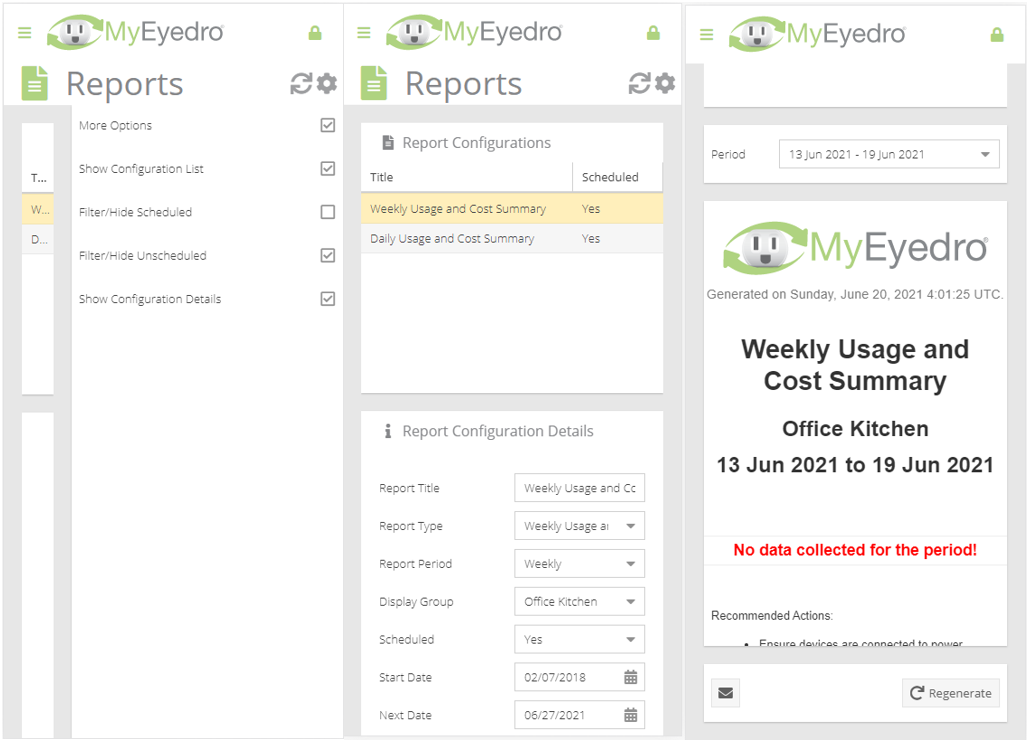
Mobile View


