Usage and Cost
The Usage and Cost report type gives a breakdown of the selected Display Group or Site’s usage and cost statistics.
Report profiles can be created and modified in the MyEyedro Report Configuration plugin and all generated reports can be viewed in the MyEyedro Report Viewer plugin.
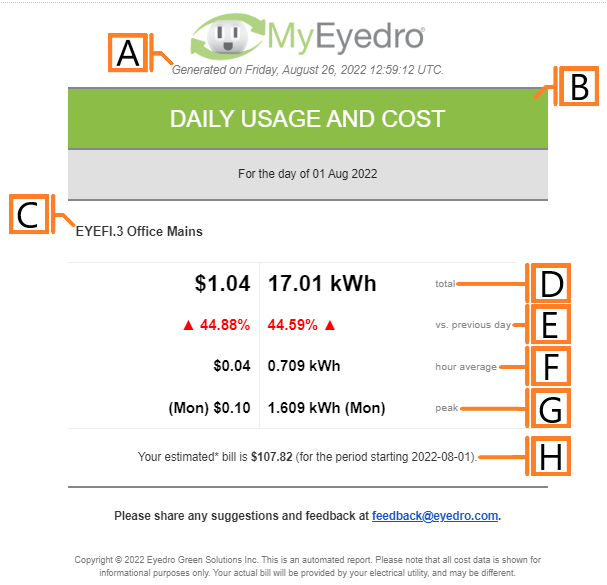
- Generation Date. The date and time the report was generated.
- Report Title. This is a combination of the report title text and report period as defined in the report configuration options.
- Display Group sub-heading for the section below. NOTE: Site reports will include a section for each Display Group associated with the site.
- Total Usage and Cost. Total consumption and cost for the reporting period.
- Comparison. Compares the total consumption and cost to the previous reporting period.
- Average usage and cost.
- Peak usage and cost.
- Estimated bill. Cost estimates are based on the display group’s configured rate profile
Configuration Options
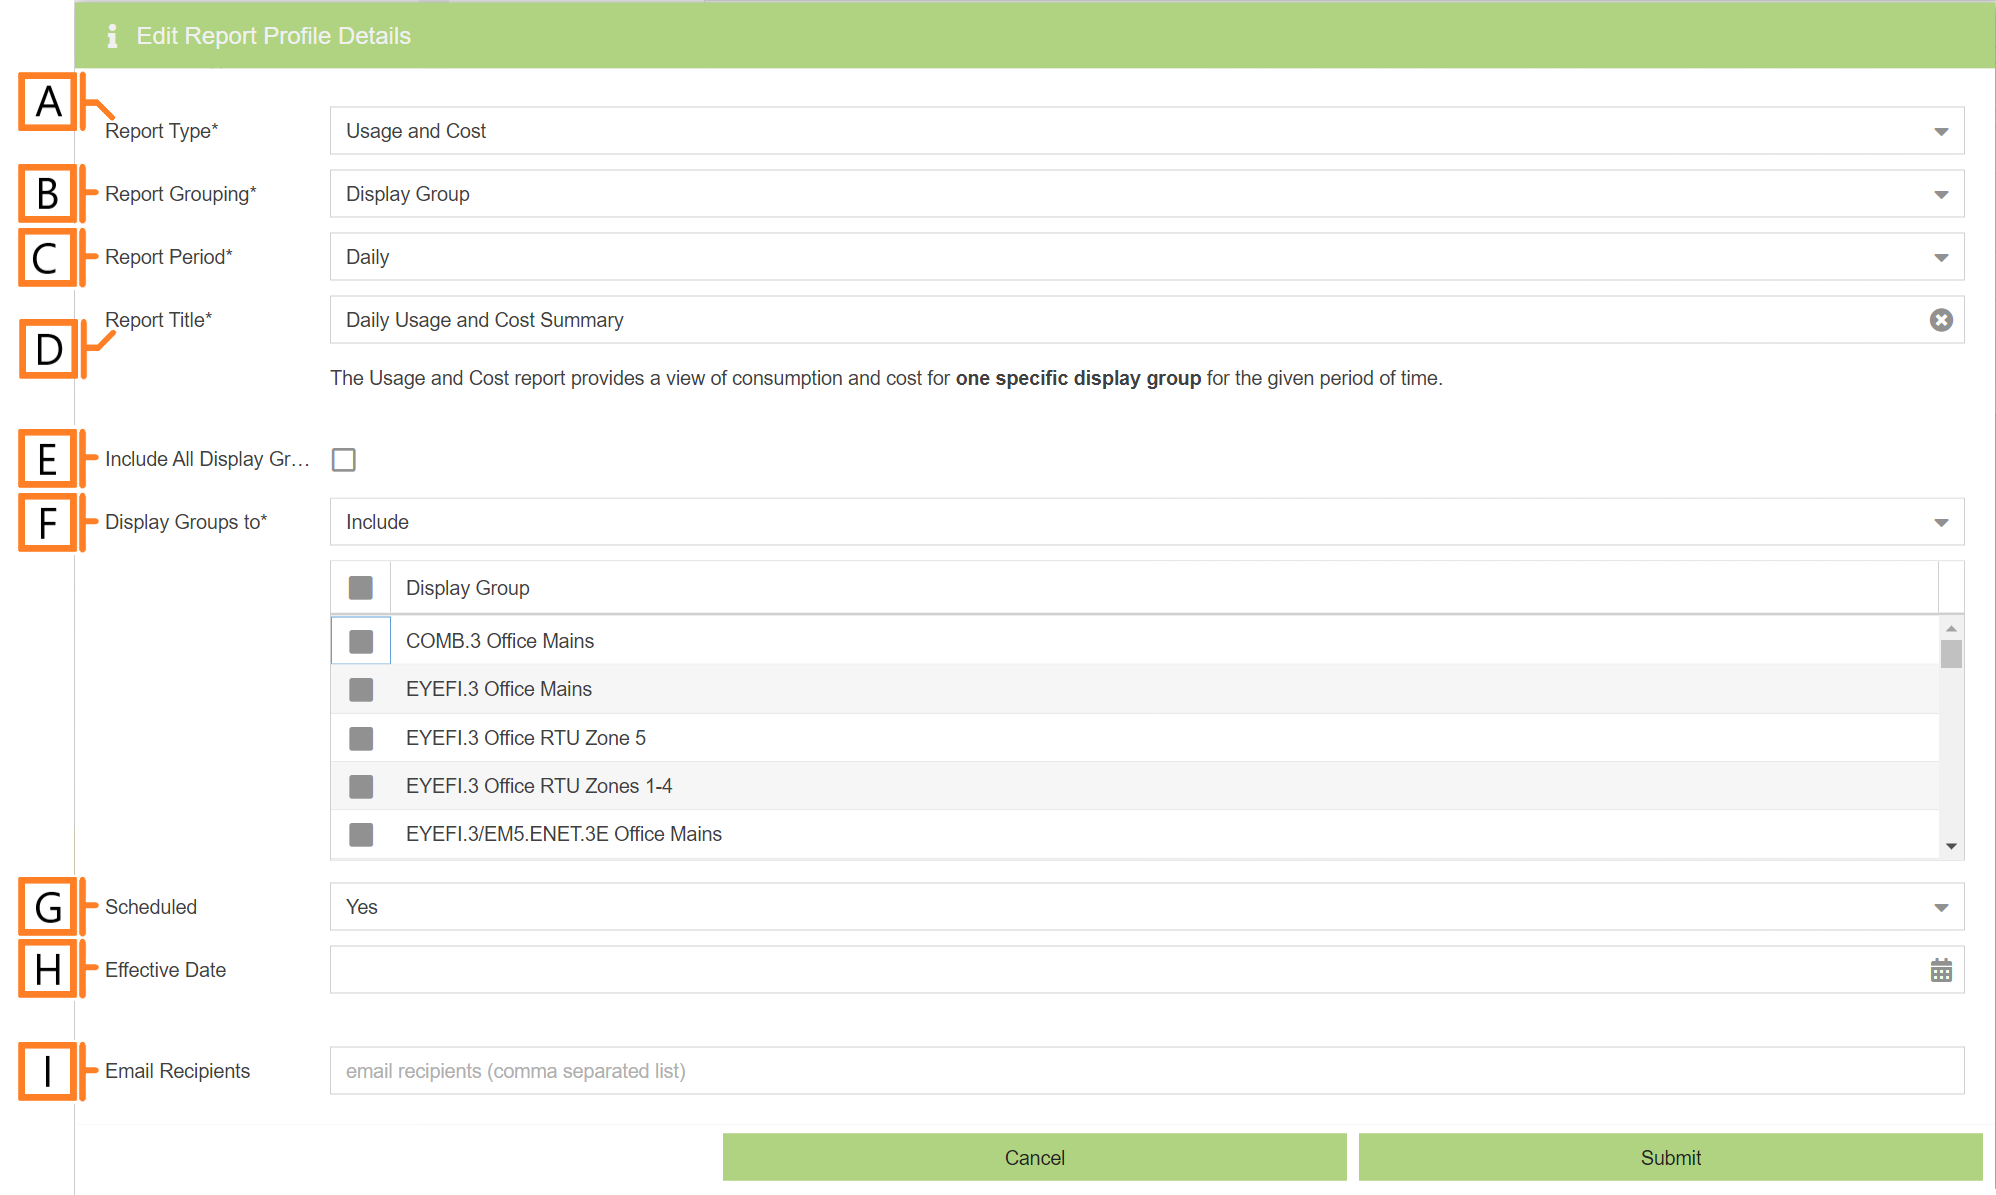
- Report Type. Specify the type of report to generate. Choose Usage and Cost.
- Report Grouping. Specify whether the report will use Display Groups or Sites as a data source.
- Report Period. The time frame which the Report will evaluate. Choose one of Daily, Weekly, Monthly, Quarterly or Annually
- Report Title. Used to easily identify what this Report Profile is being used for.
- Include All Display Groups. Ensure this option is checked to include all Display Groups in the report. NOTE: This option is not available if the Report Grouping option is set to Site.
- Display Group to. Allows you to specify a list of Display Groups to include or exclude from the report. NOTE: This option is not available if the Report Grouping option is set to Site or the Include All Display Groups option is checked.
- Scheduled. Automatically generates a report on the scheduled start day and each period there after.
- Effective Date. The first date your report is scheduled to run. NOTE: this option is only visible for scheduled reports.
- Email Recipients. The Email addresses you wish a copy of the scheduled report to automatically be sent to. NOTE: this option is only visible for scheduled reports.


