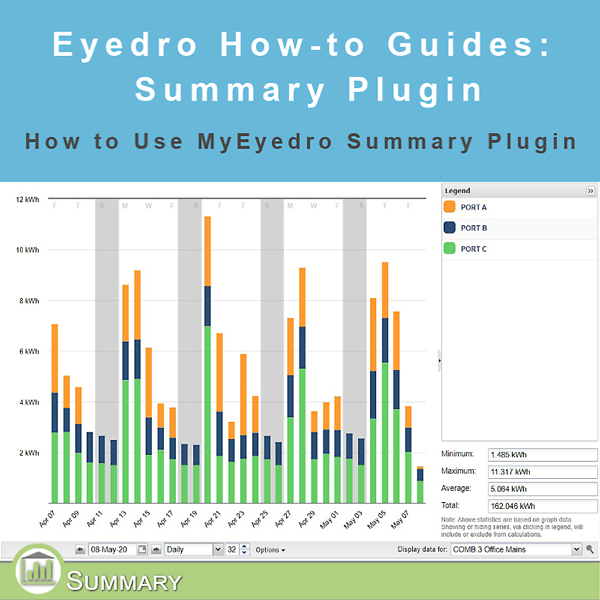
How to Use the Summary Plugin
How to Use the Summary Plugin
Purpose:
To explain how to use the Summary Plugin. As the name suggests, the Summary Plugin displays a breakdown of how much each sensor in a given Display Group measured during a given time period.
Instructions:
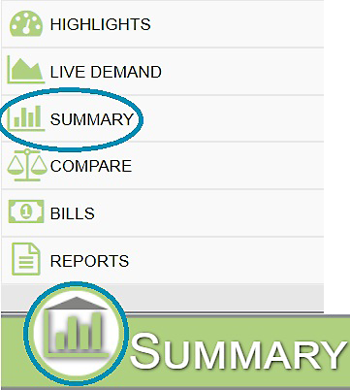
- Click on the icon in the lower left of the page (this is the Plugin Menu) and select Summary.
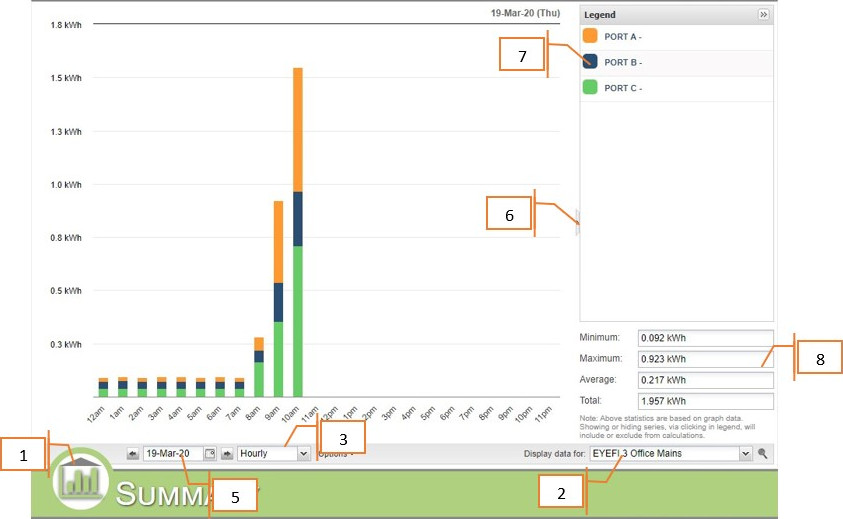
- Select the desired Display Group from the dropdown menu.
- Select the time unit from the dropdown menu.
- For time units greater than Hourly, you can set how far back from the start date the data is displayed.
- Choose which day you would like to view in the date picker.
- You can collapse the legend for a larger version of the graph.
- Clicking on a sensor in the legend turns it on or off in the graph.
- The legend also shows minimum, maximum, average and total for a given time period setting.
- The graph displays watts (W) on the left and time on the bottom.
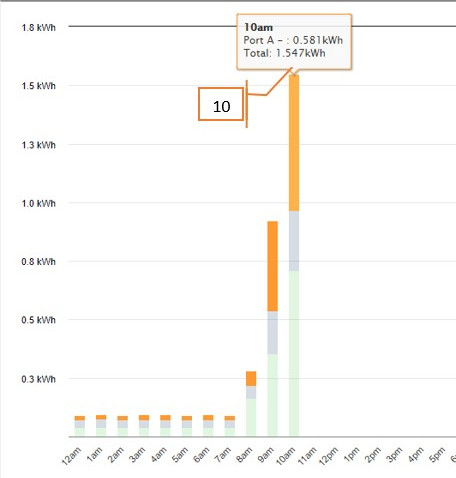
- Hover your mouse over a bar to view the time, sensor, what that sensor read at that time, and the total for that time period.
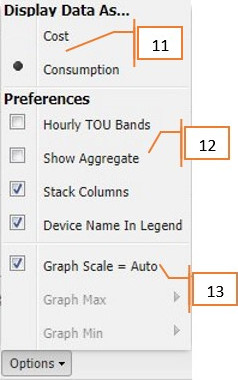
- In the Options menu you can display the data as either Cost ($) or Consumption (W).
- In Options you can turn Time of Use bands on or off (TOU rate structure only), show Aggregate (displays the total of all sensors in a Display Group), Stack Columns (displays each sensor in a display group stacked in a single column), and Device Name In Legend.
- Set the Graph Scale to automatically set a max and min value or specify those values yourself.
For more information:
To contact Eyedro Support:
Via web: Contact Us
