by Stacey McCuaig | May 19, 2017 | Blog, Customer Success Stories, Electricity Monitoring, Eyedro Case Study
Commercial Tenant Electricity Sub-Metering: Landlord Feels That Tenant Is Using More Power than Budgeted in Lease Agreement
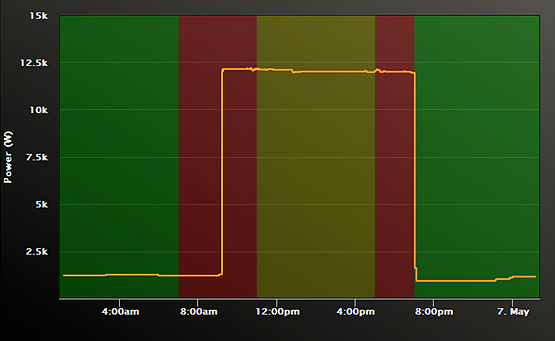
In this case study we illustrate how Eyedro has been put to use resolving a commercial tenant electricity sub-metering dispute between the tenant and the landlord of a large commercial building. As can be seen from the Eyedro real-time electricity monitoring graph data above, a tenant of a commercial building displayed an excessive electricity usage pattern that persisted for 12 hour periods. This usage was very much out of line with that of the other tenants in the building.
After some investigation it was discovered that the tenant was testing some power hungry new technology.
Via Eyedro, the landlord was able to show the tenant their actual electricity usage as well as the time period (in this case during peak electricity rate hours).
Because the landlord was sub-metering each tenant and tracking power consumption with an Eyedro Electricity Monitoring system, they were able to pinpoint the tenant’s unusual electricity consumption. The tenant’s commercial lease was then renegotiated in a way that was fair to both parties.
The landlord ultimately recovered more than $1200 in electricity costs per year from this one customer alone!
by Stacey McCuaig | Apr 12, 2017 | Blog, Customer Success Stories, Electricity Monitoring, MyEyedro
Eyedro Remote Electricity Monitoring Can Alert You to Potential System Failures in Your Home
With Eyedro’s remote electricity monitoring capability it is possible to protect the assets in your home even when you are on vacation.
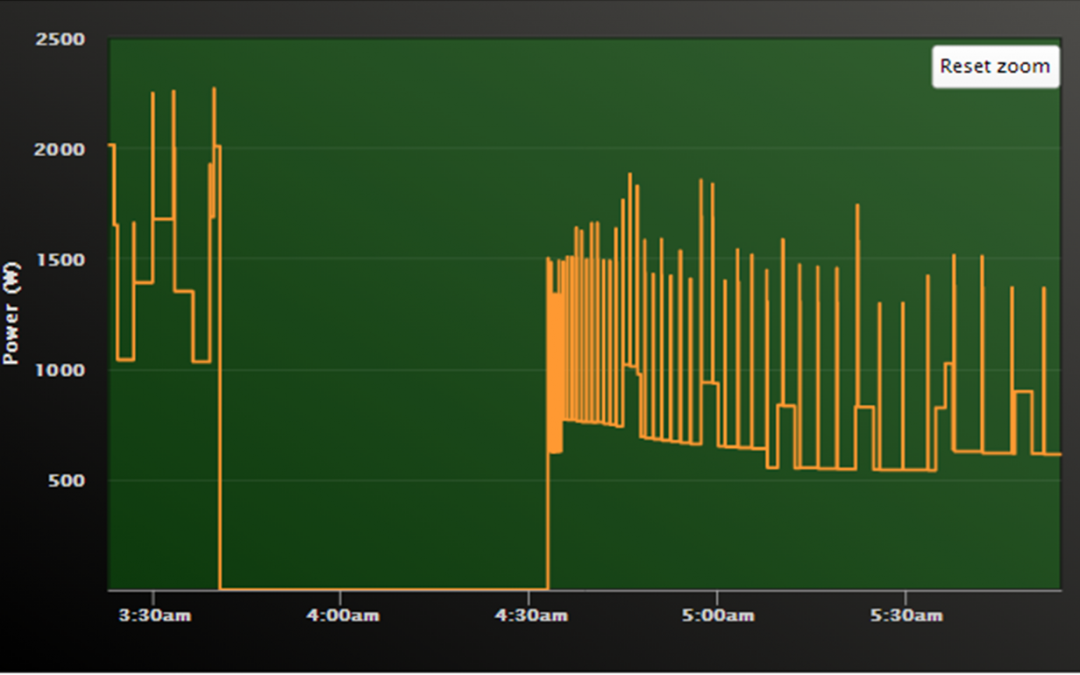
The MyEyedro screen capture below shows the electrical signature of a home owner’s sump pump. The signal dropped out during a severe weather event.
The home owner was sent an email alert of a power failure and subsequent restoration of power. This is significant because the home owner was out of the country at the time.
When the home owner checked his MyEyedro account, he could tell by the waveform created that the sump pump was working very hard to catch up after the power was restored.
Because the home owner received an Eyedro power failure alert and was able to monitor the situation remotely, there was time to contact a neighbour and prevent the possible burn-out of the sump pump motor and subsequent basement flooding.
Eyedro real-time electricity monitoring systems with cloud based software – monitor and protect your home no matter where you are in the world.
Let Eyedro help you keep an eye on your Hydro!

Eyedro monitoring sump pump during severe weather event

by Stacey McCuaig | Feb 3, 2017 | Blog, Electricity Monitoring, Energy Reduction, geothermal energy, Green Energy
Visit Eyedro at the Ontario Geothermal Association Convention 2017
Eyedro Electricity Monitoring systems – providing you with energy reduction solutions.

Find out how Eyedro electricity monitoring systems can help you reduce your hydro usage.
by Stacey McCuaig | Jan 20, 2017 | Blog, Electricity Bill, Energy Reduction, hydro bill, MyEyedro
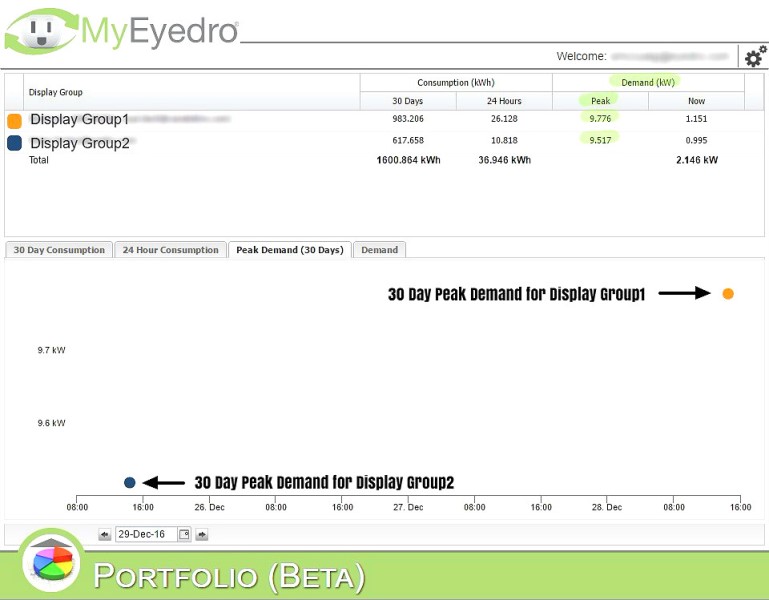
Prompted by popular “demand” for a means to capture electricity demand, Eyedro is pleased to announce the addition of the new Portfolio plugin to our MyEyedro electricity monitoring platform.
The Portfolio view allows the MyEyedro user to determine 30 Day Peak Demand selectable by date, Instantaneous Peak Demand, 24 Hour and 30 Day Consumption.
In order to activate the Portfolio plugin the user’s MyEyedro account must have at least 2 display groups. In the case where a user has only one Eyedro device, a duplicate display group can be created.
For more information on the Portfolio plugin see page 58 of the MyEyedro User Guide.
Electricity Demand Explained
Electricity Demand is the maximum amount of electricity being used at any given point in time. Demand fluctuates throughout the day. For example, in the morning as people get up and get ready for work, take showers, run their cappuccino machines, hair dryers or waffle makers, electricity demand increases. In the early evening there is a second period of peak demand as people arrive home from work, turn on lights and appliances, cook dinner, fire up computers, etc. The greater the electricity demand, the greater the strain on the electrical grid to supply that demand, which is why many utilities will charge the consumer more during times of peak demand (Time-of-Use electricity rates). Time-of-Use rates are intended to take some of the strain off the grid by encouraging conservation at times of peak demand.
30 Day Consumption View:
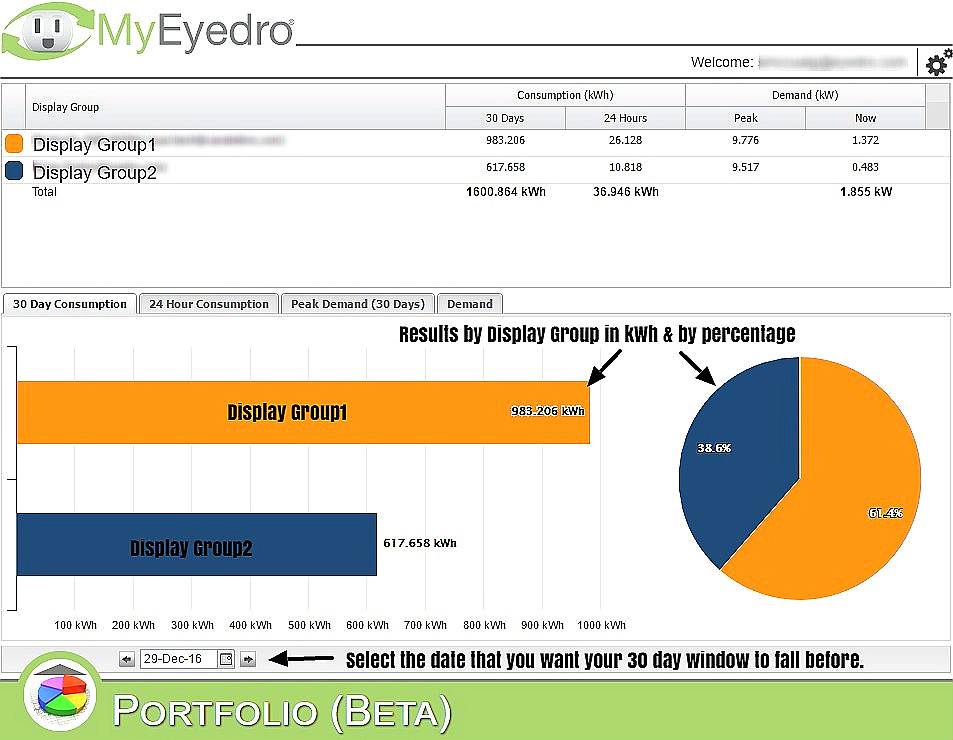
30 Day electricity Consumption Data
24 Hour Consumption View:
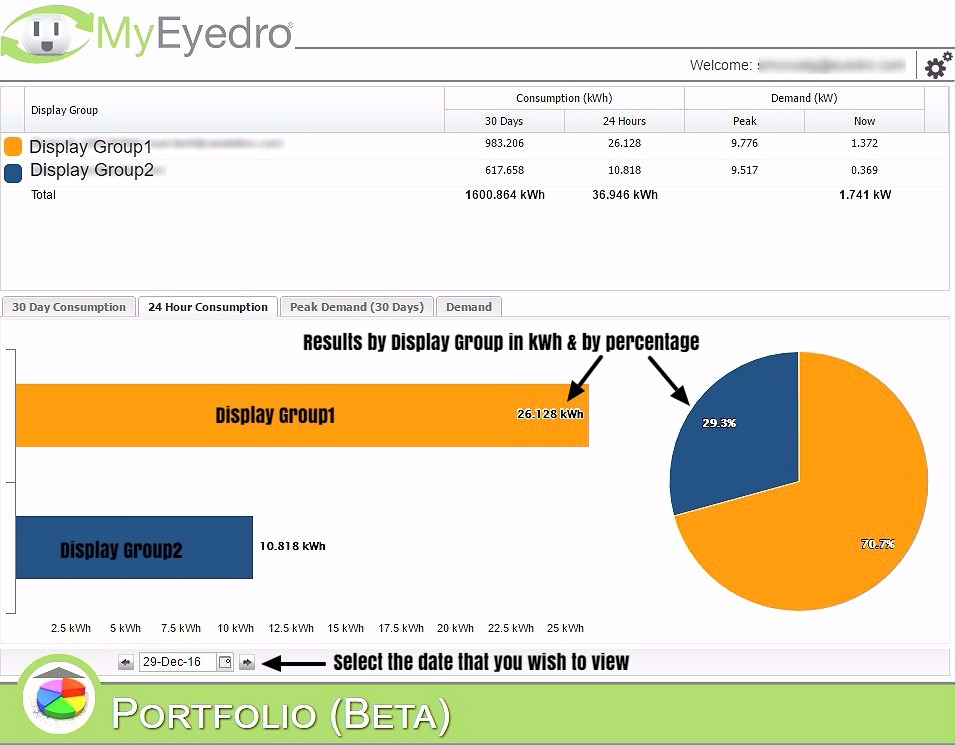
24 Hour Electricity Consumption Data
by Stacey McCuaig | Jun 27, 2016 | Blog, Customer Success Stories, Electricity Bill, Energy Reduction, MyEyedro
I, like most Ontarians (and Hydro users everywhere) have become more than a little bit disgruntled with the sharply rising cost of electricity. Every month we wait in trepidation for the arrival of the dreaded electric bill.
With the goal of energy reduction in mind, I decided to install an Eyedro Real-Time Electricity Monitor in a secondary breaker panel that powers my living room lights, outlets, and my desktop computer.
As a new Eyedro Electricity Monitoring Systems user I was shocked to discover how much electricity was being consumed by the gadgets in my home even when they weren’t actively in use.
Since the MyEyedro cloud based software offers real-time electricity monitoring, I was able to determine through experimentation (flicking switches, powering down appliances, turning breakers off and on) which of my devices was using the most power. It quickly became obvious who the main culprit was – the tower computer that lurks in the shadows under my desk, fans humming away night and day, red LEDs glaring defiantly, and using twice the electricity of anything else that I was monitoring with my Eyedro system!
For more on computer energy consumption here’s a great article from howtogeek.com – PSA: Don’t Shut Down Your Computer, Just Use Sleep (or Hibernation)
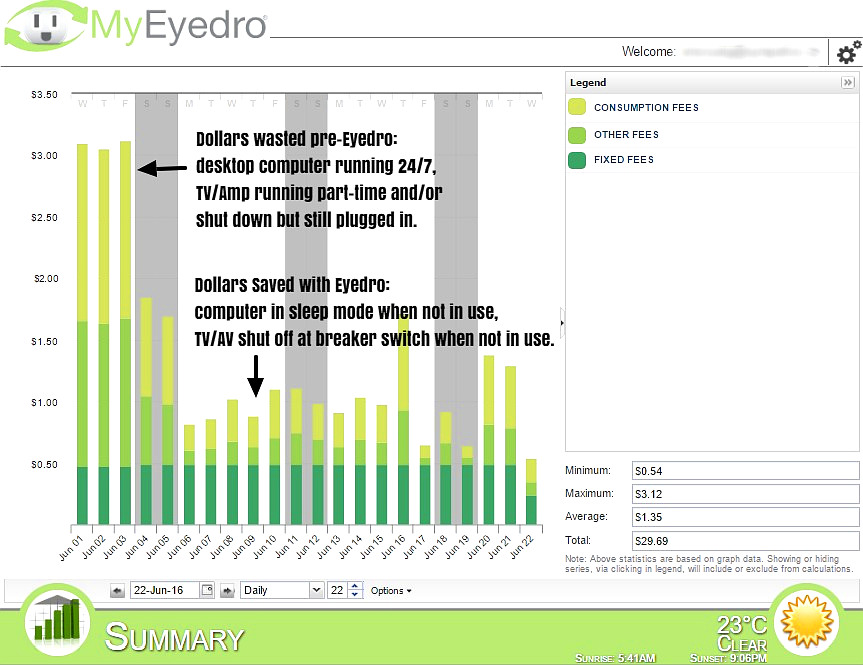
By making a few relatively painless adjustments, (and sending out gentle reminders to recalcitrant participants – I can see how much hydro you’re using even when I’m not home!) I have been able to almost immediately realize an overall cost savings of roughly 60% on the power usage that I am tracking with my Eyedro electricity monitoring system.
As the following graphs beautifully illustrate in both kWh consumption and dollar values, with Eyedro it really is possible to Keep an Eye on Your Hydro!
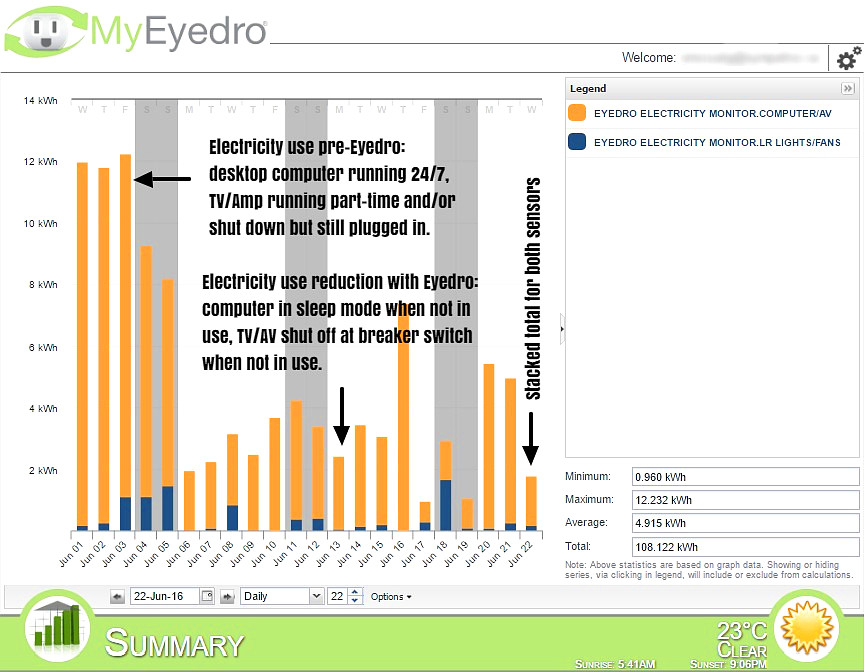
Eyedro Home Electricity Monitor: Daily Consumption in kWh
Eyedro Home Electricity Monitor: Daily Cost Savings