by Nick Gamble | Feb 19, 2025
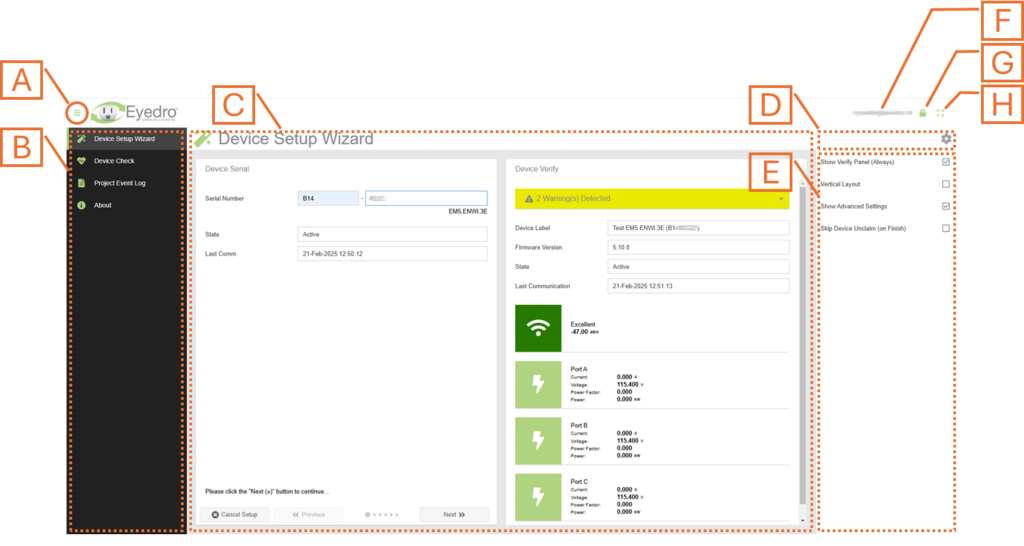
Navigating the Eyedro Install Tool is simple and intuitive. The below image highlights the key regions of the user interface and how to get around.
- Plugin Selection Menu Button. Click this button to expand or contract the plugin selection menu.
- Plugin Selection Menu. Lists all available Eyedro Install Tool plugins. NOTE: Not all plugins are available to all users.
- Plugin Region. Presents the contents of the selected plugin. Details for each plugin can be found in later sections of this document.
- Plugin Tools. Contains available tools for the plugin. Typical tools include plugin options and data refresh.
- Plugin Options Region. Contains the plugin options menu (if applicable).
- Current User. Displays the email address of the currently logged in user.
- Sign Out Button. Click this button to sign out of your user account and redirect to the Eyedro Install Tool Sign In page.
- Fullscreen Button. Click this button to hide all menus (plugin selection menu and plugin menu region) and expand the Plugin Region to fill your screen. Press ‘Esc’ to exit full screen mode.
- Help Button. Click this button to view the online Eyedro Install Tool User Guide page corresponding to the plugin that is currently displayed in the plugin region.
by Nick Gamble | Jul 29, 2024
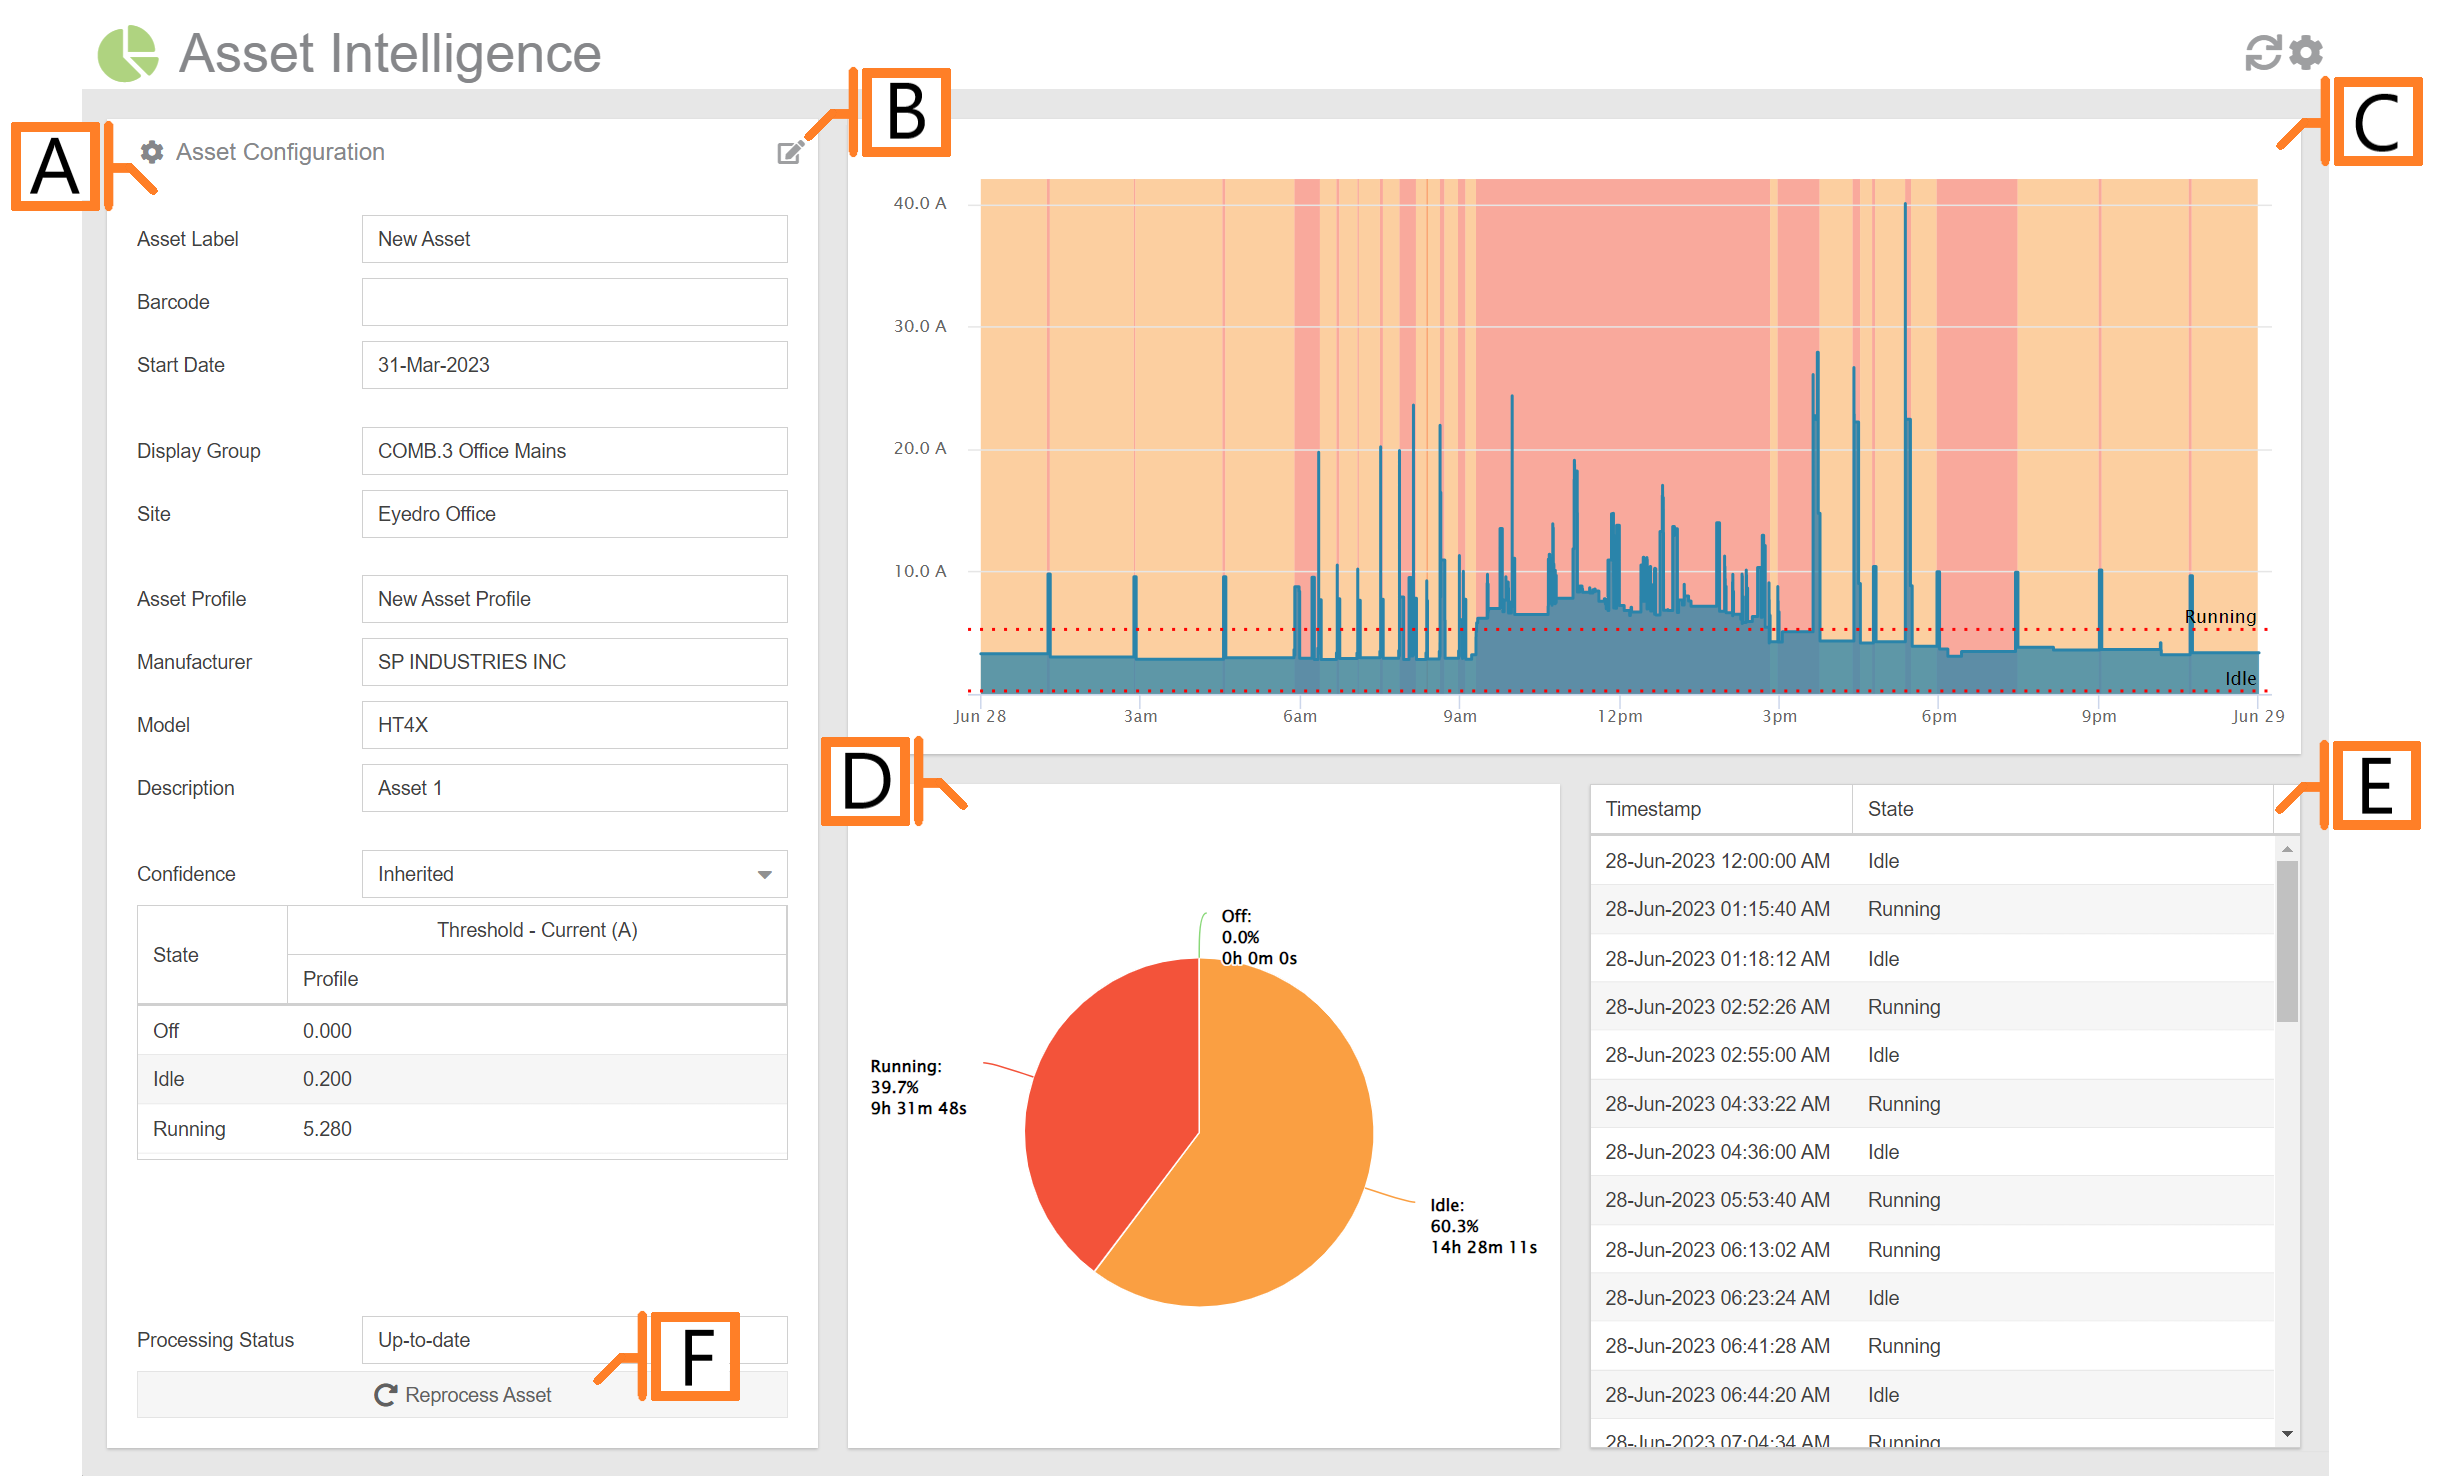
The MyEyedro Asset Intelligence plugin provides detailed run-state analysis for monitoring machinery and lab equipment. This plugin is intended to be used for analysis of multiple pieces of equipment (assets) that share the same type of properties and expected operation (asset properties) – i.e. monitor a dozen milling machines from Acme Corp.
It is assumed that each “asset” is being independently monitored either by installing Eyedro Electricity Monitors on their isolated branch circuit(s) or using Eyedro Machine Monitoring products inline with the individual pieces of equipment.
The Asset Intelligence plugin is only available to users with a MyEyedro Professional license.
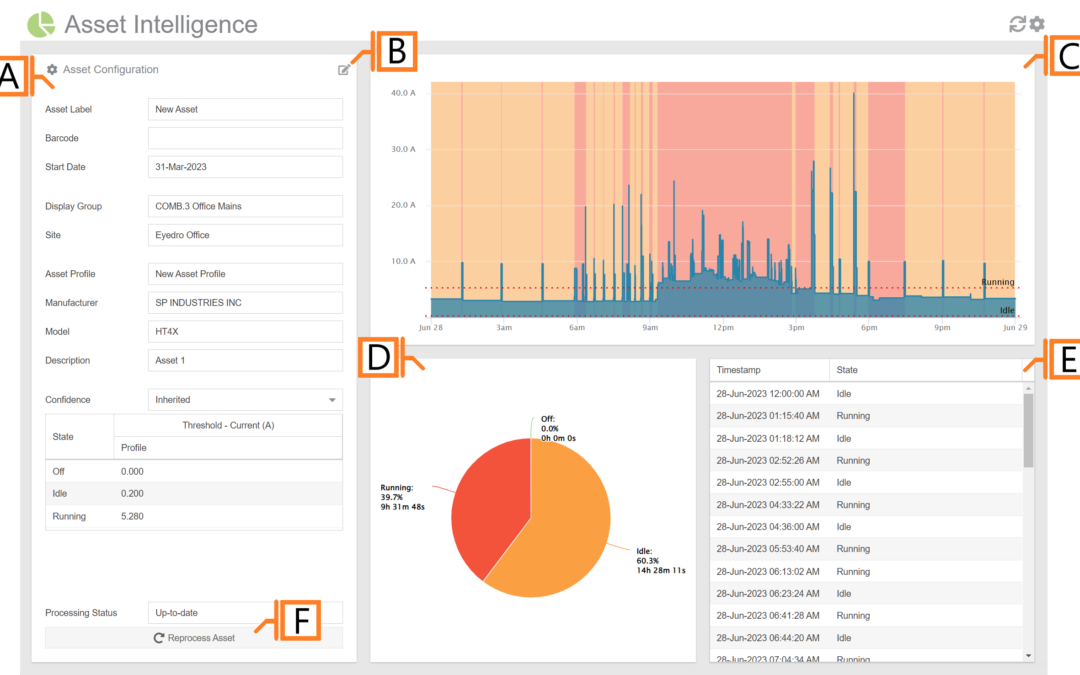
- Asset Details. Displays the currently selected asset’s configuration and profile details.
- Asset Edit button. Clicking on this button will redirect you to the Asset Configuration plugin for editing of either the asset or the asset profile associated with it.
- Run State Graph. Displays electricity demand for the selected 24 hour period. Optionally, state thresholds and state overlay can be shown on the graph.
- Utilization Chart. Pie chart indicating time spent in each state during the period and the percentage of overall time.
- Transition Details. A text based log of each state transition detected.
- Reprocess Asset button. Press this button to force the reprocessing of the asset
Asset Intelligence Plugin Tools and Options
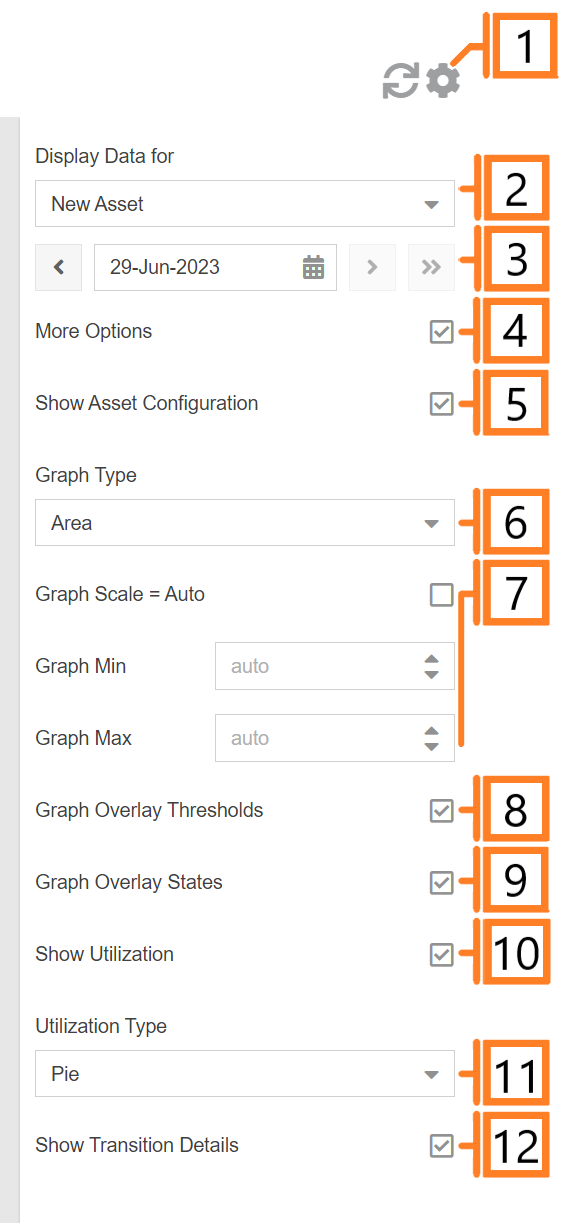
- Plugin Tools:
- Refresh. Update the data and visuals on screen.
- Options. Expand or collapse the options menu.
- Select which Asset to evaluate. NOTE: this option will only appear if there are more than one Asset defined.
- Choose the Date for which Asset data is displayed. By default this will be set to the previous date (yesterday).
- Check the More Options checkbox to show additional options
- Show/hide the Asset Configuration Panel.
- The Graph Type will change what style of graph is used to display the data.
- Graph Scale. Unchecking will allow the user to enter Graph Min, and Graph Max values.
- Show/hide State Threshold overlay on the Run State Graph.
- Show/hide State Overlay coloured plot bands on the Run State Graph.
- Show/hide the Utilization Chart.
- The Utilization Type will change what style of chart is used to display the data. This can be either a pie chart or a stacked bar chart.
- Show/hide the Transition Details log.
by Nick Gamble | Jul 29, 2024
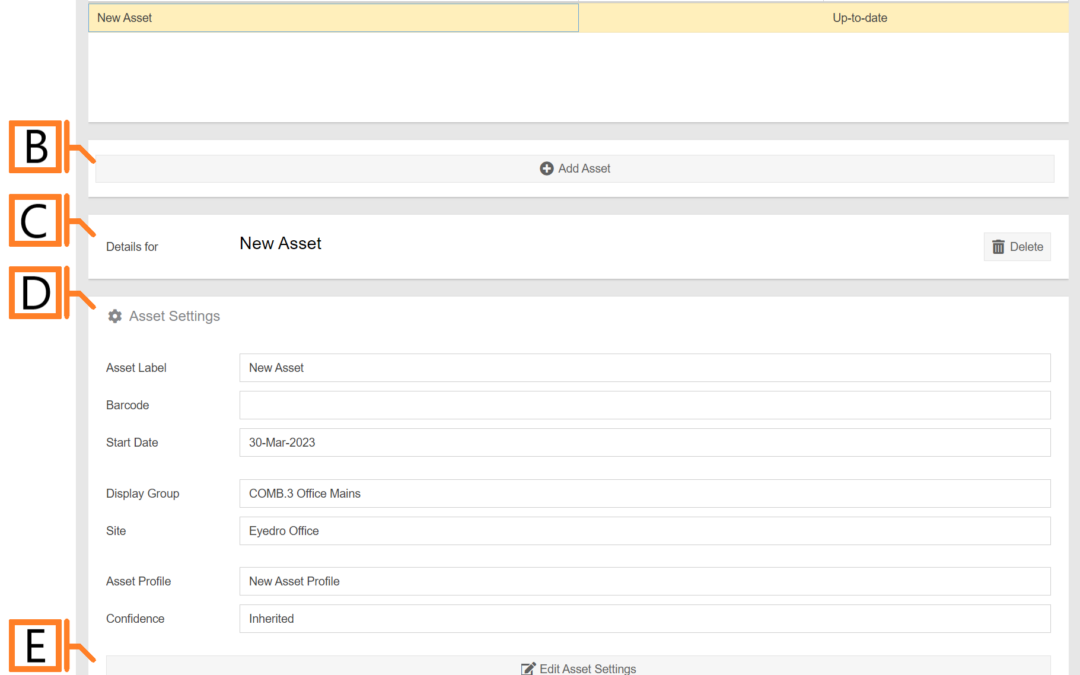
Assets are representative of a physical piece of equipment belonging to the specifications outlined in their corresponding Asset Profile.
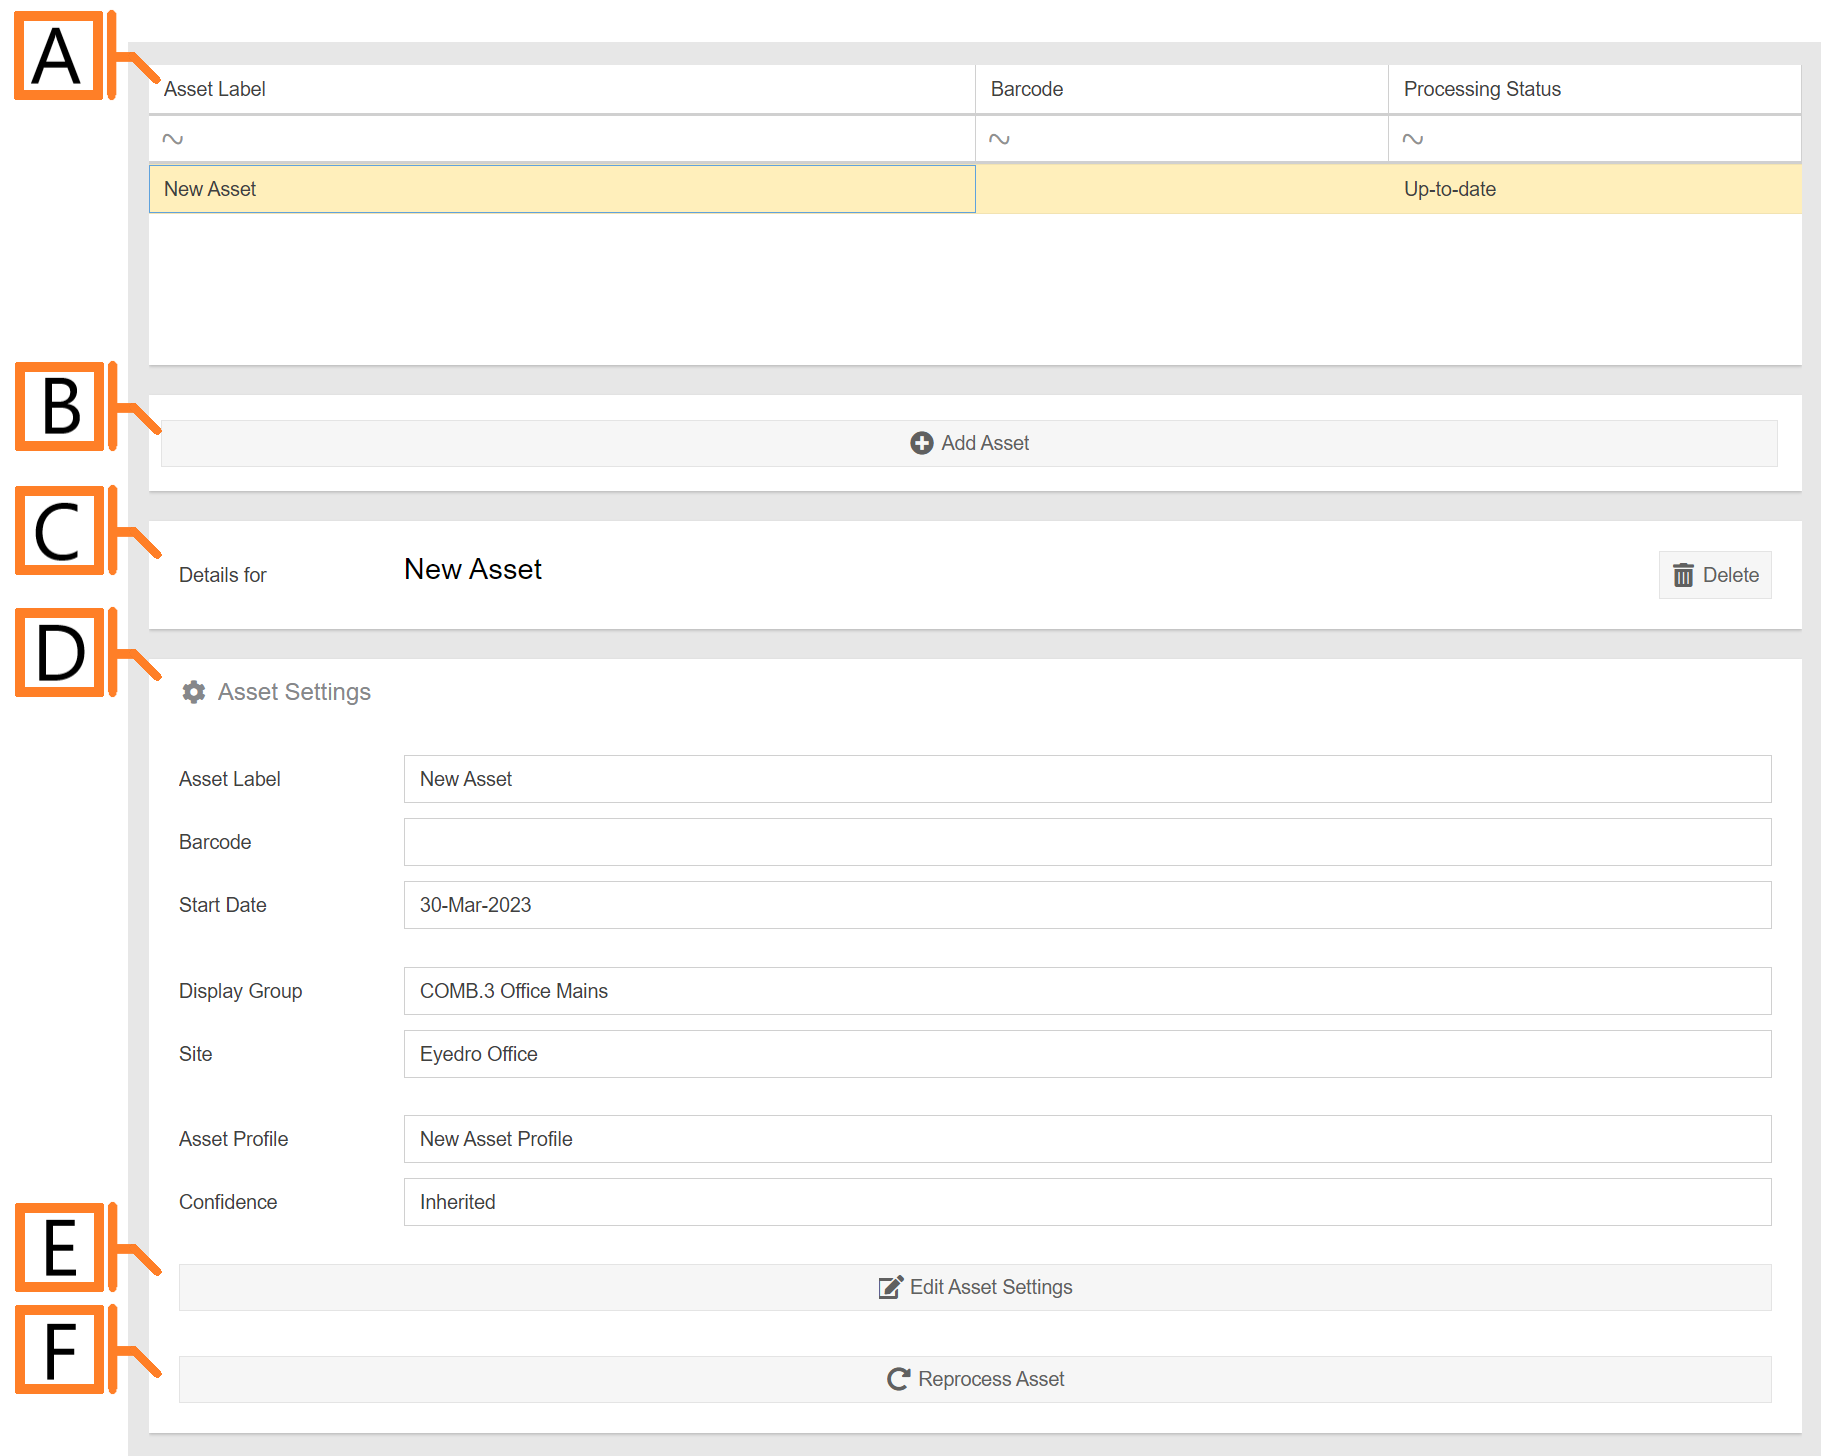
- Asset List. List of assets associated with your MyEyedro user account.
- Add button.
- Details panel. Displays the currently selected asset.
- Settings panel. Displays the asset settings.
- Edit Settings button. Pressing this button to enter the editing form.
- Reprocess Asset button. Recalculate run-state blocks for this Asset.
by Nick Gamble | Jul 29, 2024
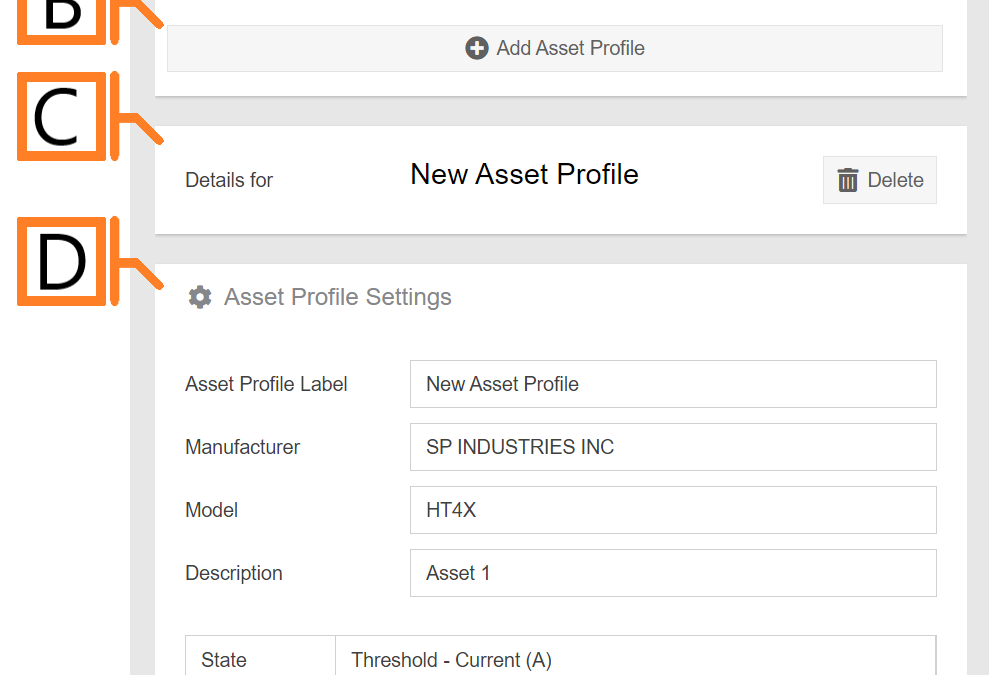
Asset Profiles are representative of a specific model of machinery or equipment from which baseline current draw can be established for each of the various run-states (Running/Idle/Off).
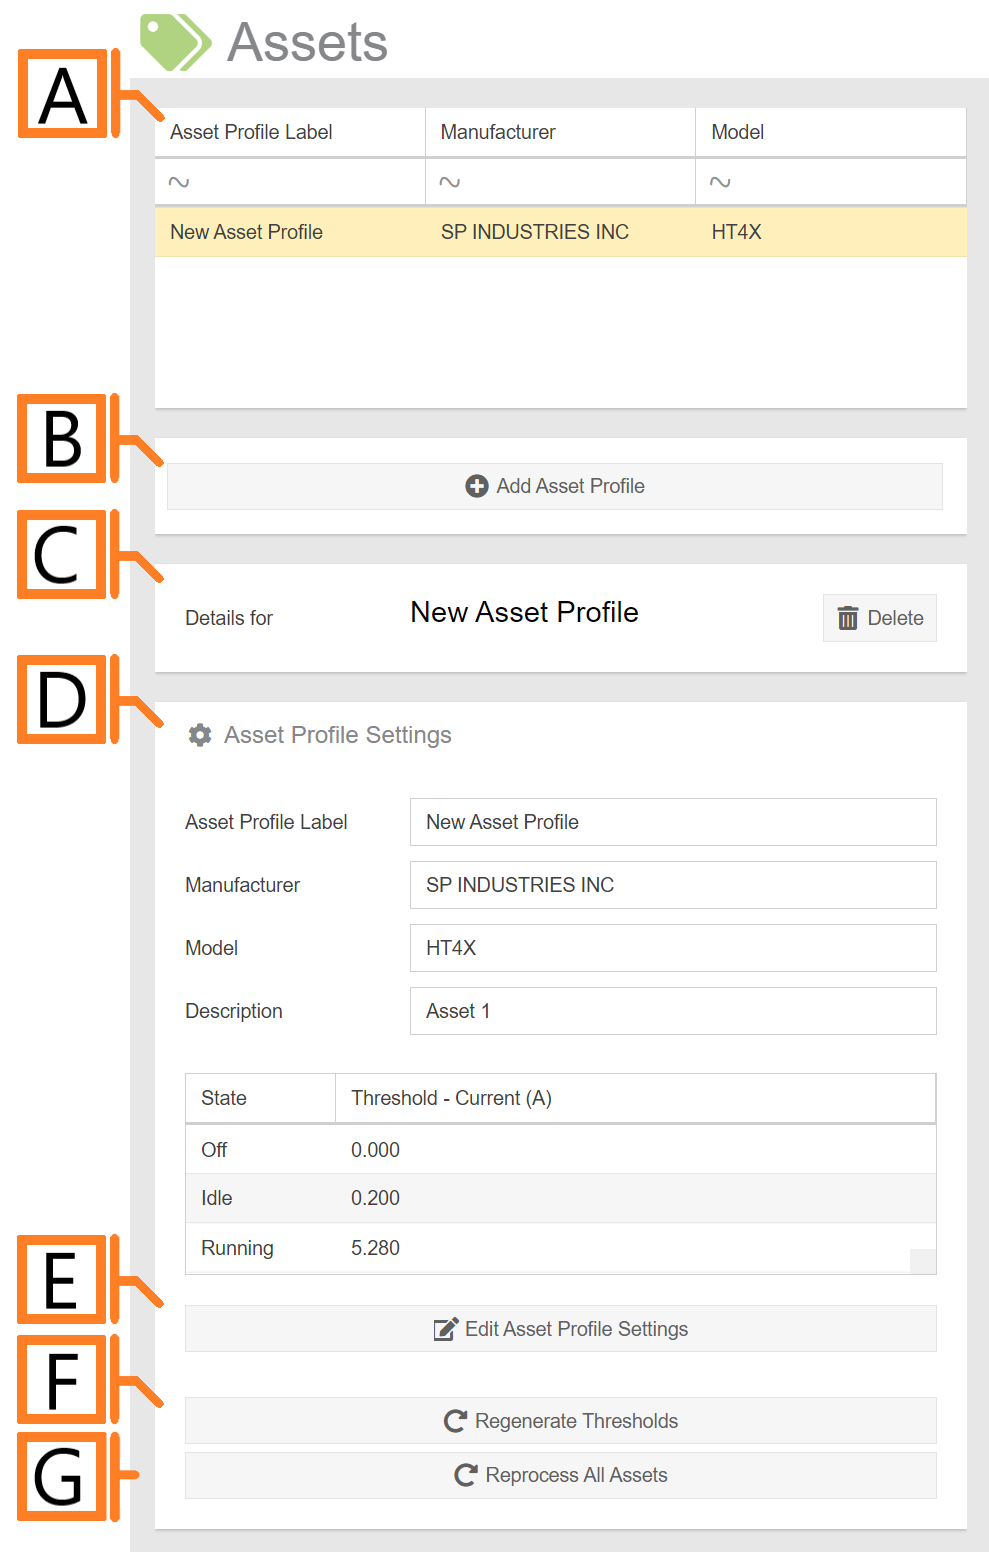
- Asset Profile List. List of profiles associated with your MyEyedro user account.
- Add button. Pressing this button will open a dialog which will create a new profile.
- Details panel. Displays the currently selected profile.
- Settings panel. Displays the asset profile settings.
- Edit Settings button. Press this button to enter the editing form.
- Regenerate Thresholds button. Regenerate the thresholds determined for the profile.
- Reprocess All Assets button. Recalculate run-state blocks for all associated assets.
by Nick Gamble | Jul 26, 2024
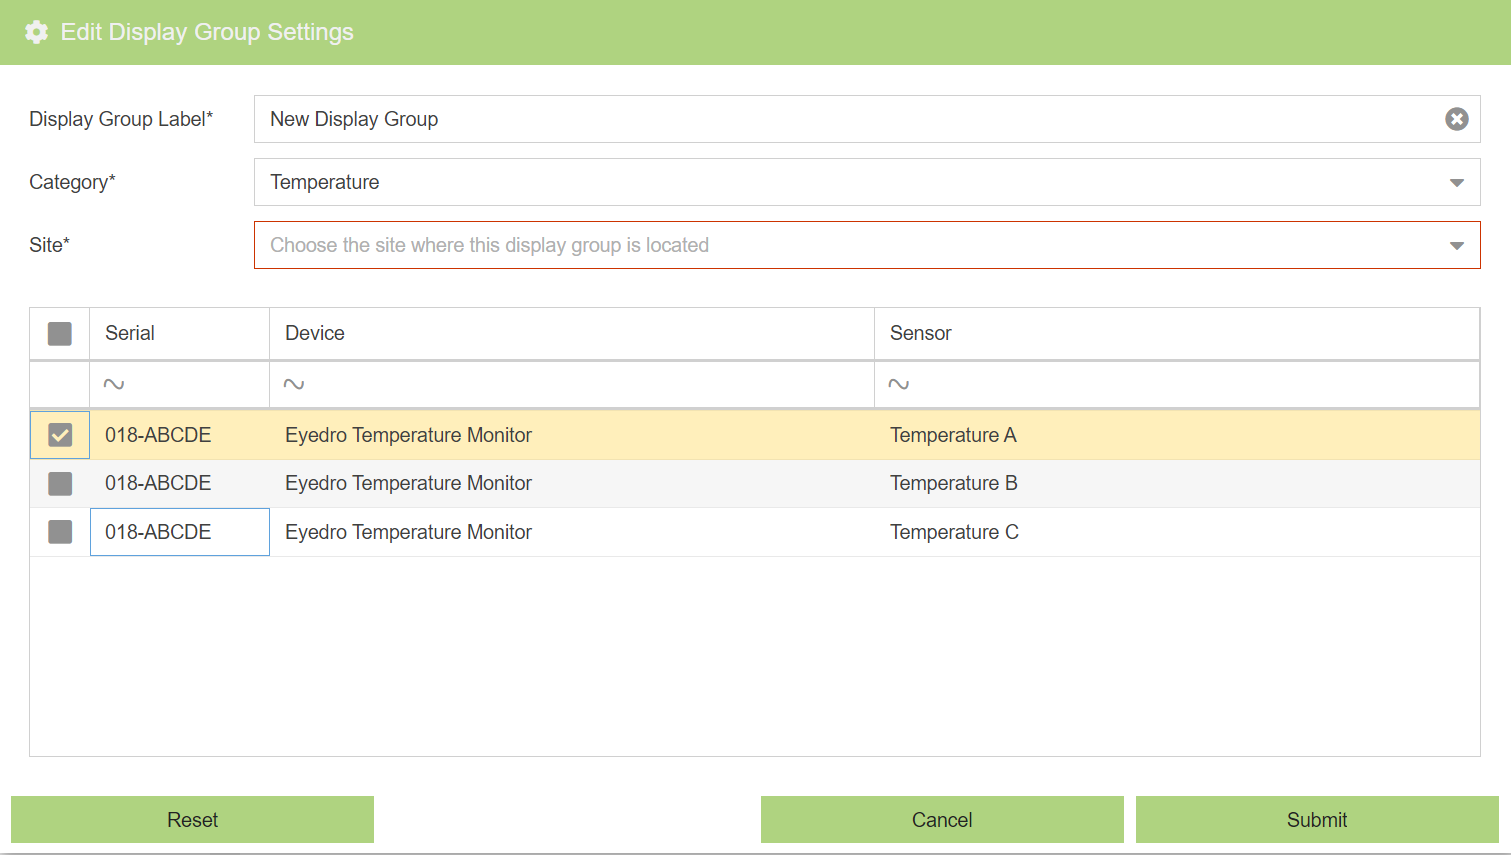
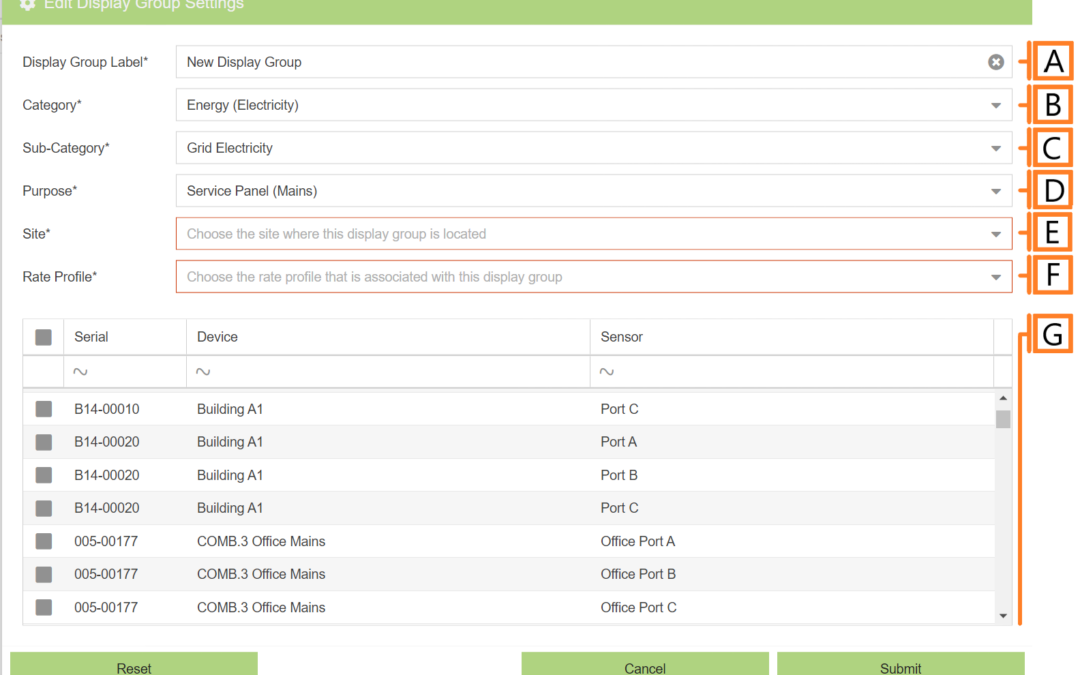
To add a display group, navigate to the Display Groups Configuration plugin. Click the ‘Add Display Group‘ button. This will open a form which is used to specify the details.
Energy

- Display Group Label. Label should be unique and descriptive for easy identification.
- Category. The type of data measured (i.e. Energy, Volume or Temperature). NOTE: This value is used as a filter in some MyEyedro plugins.
- Sub-Category. A more granular description of what is being measured within the Category (i.e. Grid Electricity, Renewables, etc.). NOTE: This value is used as a filter in some MyEyedro plugins.
- Purpose. Designates the purpose of the electrical circuit being monitored. NOTE: This field is strictly for organizational purposes.
- Site. The Site to associate with this Display Group. See Sites Configuration for more details. NOTE: The time zone used when graphing data comes from the Site configuration.
- Rate Profile. The Rate Profile to utilize when calculating costs. See Rates Configuration for more details.
- Data Sources. A list of device sensors that can be include in your Display Group by checking the box to their left. NOTE: You can only add sensors from Devices that have been claimed under your user account and that match the selected Category.
IMPORTANT: For practical reasons, each Display Group should be limited to include no more than 10-20 sensors maximum. Failure to limit may result in significant delays (or possible timeouts/errors) while loading data in some of the MyEyedro plugins. A large number of sensors also makes many of the graphs cluttered and hard to view. It is best practice to limited to a small number of devices or groupings of devices.
Volume
If you are adding a display group representing volume, Choose “Volume” from the Category field. Most options are the same as energy. The differences are identified below.
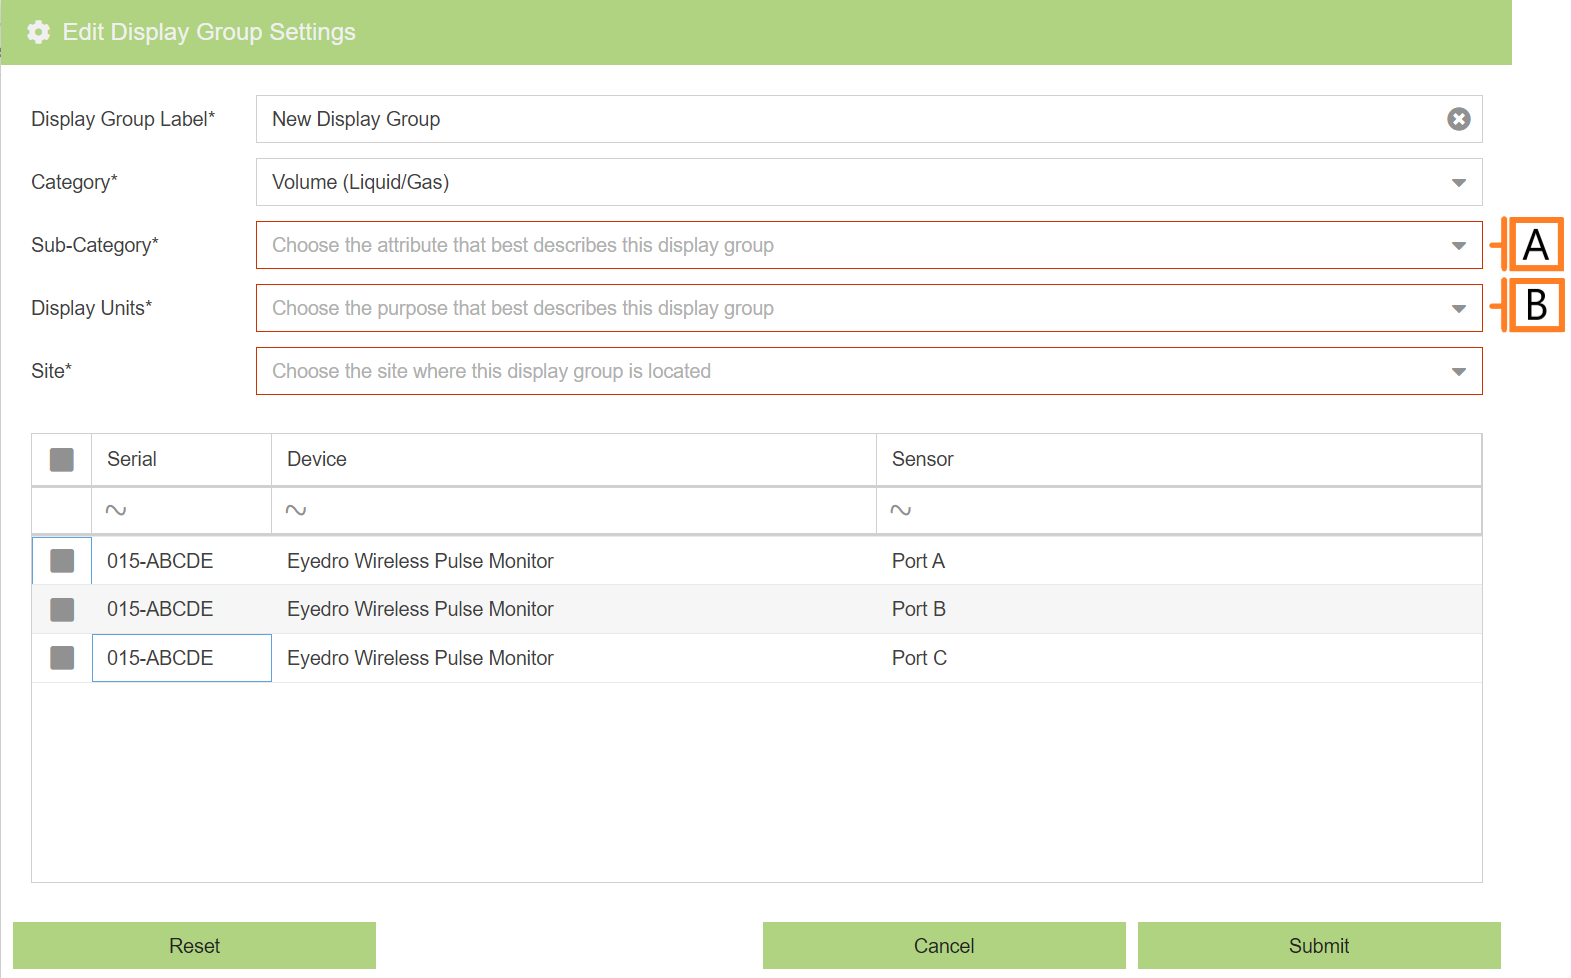
- Sub-Category. A more granular description of what is being measured within the Category (i.e. Water, Natural Gas, Compressed Air). NOTE: This value is used as a filter in some MyEyedro plugins.
- Display Units. The units to display measurement data (i.e. Gallons, Liters, Cubic Feet, Cubic Meters).
Temperature
To add a display group representing temperature, Choose “Temperature” from the Category field. Most options are the same as energy. The differences are identified below.