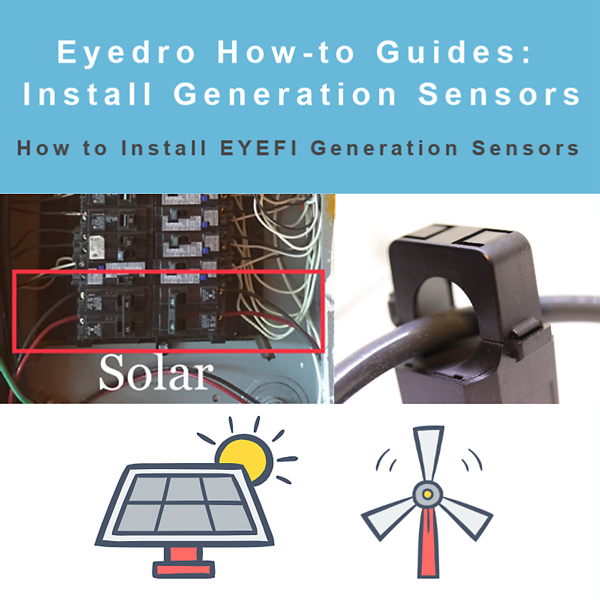
Ensure that the outputs of the generation sensors are producing negative values, representing negative consumption (generation).
Create a Display Group for the Generation sensors. You do this by clicking on the Display Groups tab in the same options screen you used to claim your device then clicking on the “Add Display Group” button.
You can now set up your Net Meter plugin and view your generation values.
If you need help setting up your Net Meter plugin you can find the How-to for that topic Here.
The How-to for claiming a Device, adding a Display Group, and other Device settings related issues can be found Here.
Generation Data in the Net Meter plugin and the Live Demand plugin:
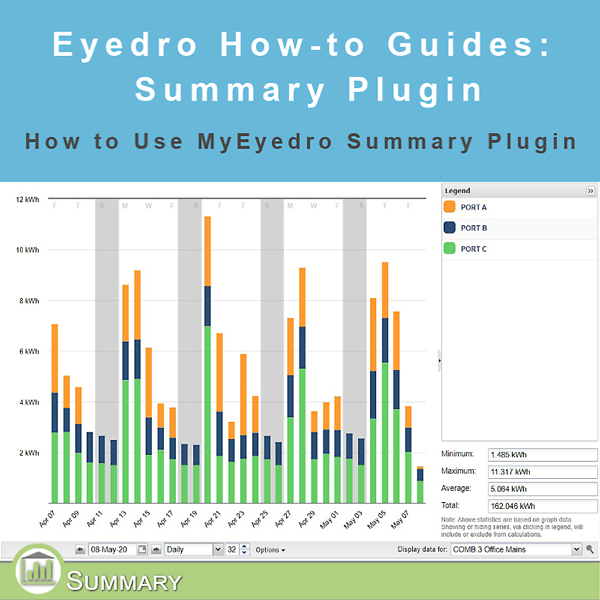
To explain how to use the Summary Plugin. As the name suggests, the Summary Plugin displays a breakdown of how much each sensor in a given Display Group measured during a given time period.
Summary in Plugin Menu
Instructions:
Click on the icon in the lower left of the page (this is the Plugin Menu) and select Summary.
Select the desired Display Group from the dropdown menu.
Select the time unit from the dropdown menu.
For time units greater than Hourly, you can set how far back from the start date the data is displayed.
Choose which day you would like to view in the date picker.
You can collapse the legend for a larger version of the graph.
Clicking on a sensor in the legend turns it on or off in the graph.
The legend also shows minimum, maximum, average and total for a given time period setting.
The graph displays watts (W) on the left and time on the bottom.
Hover your mouse over a bar to view the time, sensor, what that sensor read at that time, and the total for that time period.
In the Options menu you can display the data as either Cost ($) or Consumption (W).
In Options you can turn Time of Use bands on or off (TOU rate structure only), show Aggregate (displays the total of all sensors in a Display Group), Stack Columns (displays each sensor in a display group stacked in a single column), and Device Name In Legend.
Set the Graph Scale to automatically set a max and min value or specify those values yourself.
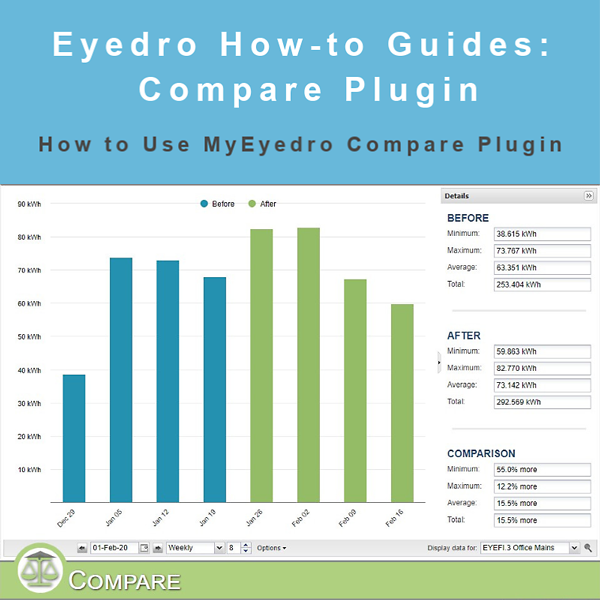
To explain how to use the Compare plugin in My.Eyedro.com. The Compare plugin allows you to do a comparison before and after a specific date for a given Display Group, or between two different Display Groups.
Compare in Plugin Menu
Instructions:
Click on the icon in the lower left of the My.Eyedro.com display and select Compare.
The graph has cost or consumption on the left, and time on the bottom.
Hovering your mouse over a bar in the graph provides more details about that section.
Clicking on the dot representing the color on the graph turns that part off in the display.
Select the desired Display group in the dropdown menu.
Select the date you want to compare before and after in the date picker.
Select the time units you want to view in the dropdown menu.
The number of time units viewable can be adjusted.
The details pane can be collapsed for a larger view of the graph.
The details pane states the Max, Min, Average, and total of both items being compared, as well as a percentage difference between the two items.
In Options, you can display data as either cost or consumption, and comparison type as either Before/After or Compared To.
If Compared To is selected, you can select the other Display Group from the dropdown menu as well.
Base Load is the power that is always used; the minimum consumption of a given Display Group. In order to use Base Load effectively, your Rate Profile should already be configured, and assigned to the Display Group.
Base Load From the Plugin Menu
Instructions:
Click on the icon in the lower left of the My.Eyedro.com page (this is the Plugin Menu).
Select Base Load.
Select the Display Group of interest from the dropdown menu.
What does the number displayed tell you, and how do you use it to reduce your Base Load to minimum?
Minimum Demand tells you what your Base Load was for the previous 24 hour period. Base Load includes the power that your appliances use when plugged in but in an idle state; the power used by a refrigerator when the compressor is not running, televisions with a remote on standby waiting for a signal to turn on fully. Base Load also includes devices that are always on like security systems, internet routers and digital displays (clocks).
In order to minimize your building’s Base Load, use high efficiency LED lighting, plug televisions and other devices that draw power while plugged in (but turned off) into power bars, then turn off the power bar when the device is not in use. Turn off lights when you leave a room.