To explain how to use the Highlights plugin in My.Eyedro.com.
Introduction:
Highlights displays daily average information for a selected display group. If you are viewing it on Wednesday, the average is based on the last 4 Wednesdays plus historical data for that date.
Highlights in Plugin Menu
Instructions:
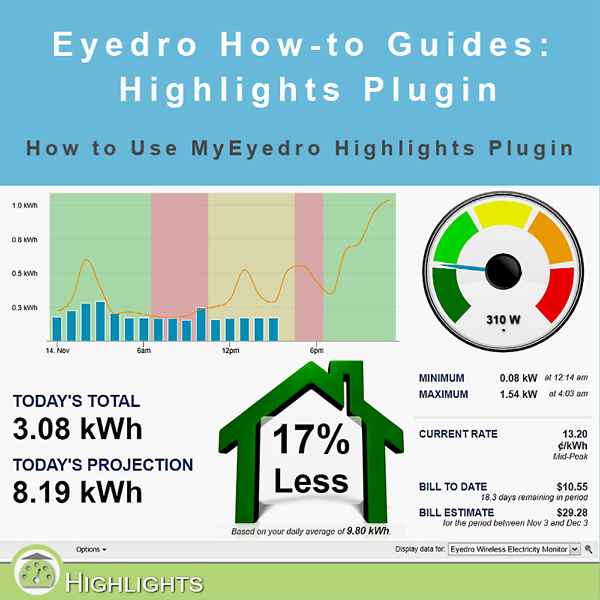
From the plugin menu (bottom left of page), select Highlights. Pick a display group to display using the dropdown box.
The graph shows the hourly data for today. The orange line is the daily average.
Hovering your mouse over the graph displays either the daily average for that hour, or the average and today’s consumption, depending on whether the point is in the past or not. Note that if your rate profile is set to Time-of-Use (TOU) the TOU bands will be displayed.
Today’s Total displays the amount of kWh consumed today so far, or the total cost for today based on the option set.
Today’s Projection displays the projected value of either kWh consumed, or cost.
The building graphic lets you know if you are using more, less or equal to the daily average (expressed as a percentage).
The dial shows current consumption values, and how close to the daily average Maximum or Minimum you are.
The current rate shows the cost/kWh you are being charged currently.
Bill to date and Bill Estimate are calculated values using the amount of kWh used (from our sensors) and your Rate settings.
Use the Options dropdown menu to customize your Highlights view. Change data to display as either Cost or Consumption.
Display the overlay as either a house (for residential use) or a building (for business/industrial use).
Set the Gauge Max = to the Daily Max or as a specific percentage.
Set the Gauge Colors for different percentages based on your personal preference.
To explain how to use the Insights plugin in My.Eyedro.com. Note that you will need to have set up your rates to get the most out of this plugin. Please review How to Set Up Your Rate Profile for a refresher on this subject.
Insights in the Plugin Menu
Instructions:
Click on the icon in the lower left of the screen (this is the Plugin menu).
Select the Display Group you want to use from the dropdown menu.
Select the date(s) you wish to view using the date picker.
Select the time interval that you wish to see from the dropdown menu, the options are single day, week, and month.
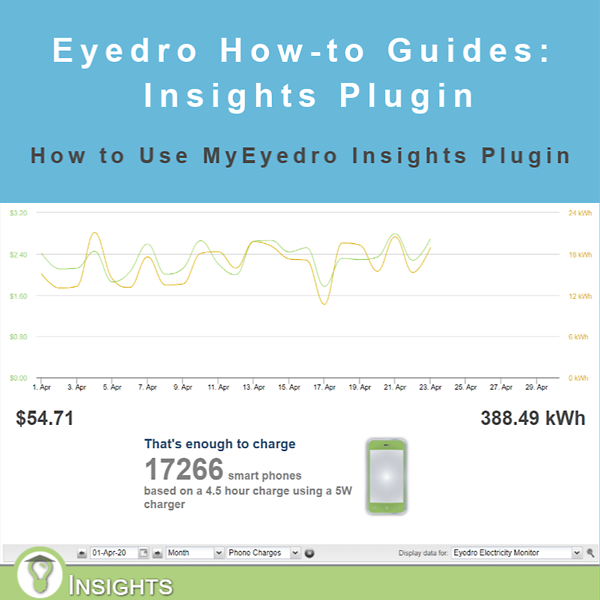
Select which Insight you want to show using the dropdown menu.
You can set the display to cycle using the play button.
You can add Insights by clicking on the Edit Insights button.
You can name, set the values, upload an image, activate, and remove insights on the Edit Insights page.
To return to the main screen of the plugin, click the Return to Insights button.
The graph has cost on the left, consumption on the right, and either time of day or days on the bottom depending on the display selected.
A summation of cost is shown on the left, and a summation of consumption is shown on the right.
You can hover your mouse on a point on the graph to display either that hour’s cost and consumption if Day is selected, or that day’s cost and consumption if Week or Month is selected.
To explain how to configure MyEyedro reports in the Reports plugin.
You will need to set up your MyEyedro Rate profile before you configure your reports.
Types of Reports:
The Reports plugin generates two types of reports:
Weekly Site Summary report:
The Weekly Site Summary report will include all the Display Groups associated with your MyEyedro account. The time interval for this report is one week (Sunday to Saturday).
Usage and Cost Summary report:
The Usage and Cost Summary report is set for an individual Display Group (multiple reports may be created as required). The available time intervals for this report type are Daily, Weekly, Monthly, Quarterly and Annually.
Plugin Menu
Instructions:
Click on the icon in the lower left of the My.Eyedro.com website. This opens the plugin menu. Select Reports.
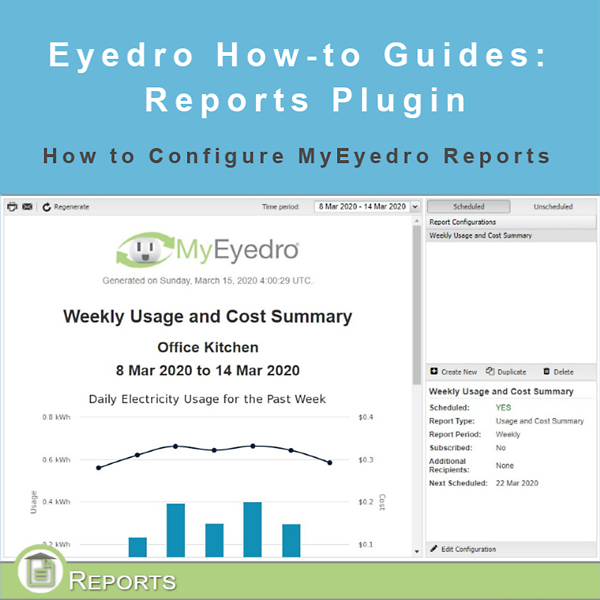
The last scheduled report will be displayed. If there is no report there will be a notification of this asking if you want to set one up.
You can choose between Scheduled and Unscheduled reports here.
Select various report configurations here.
Create a new report, copy a report configuration, and delete a configuration here.
Edit the selected report configuration here.
If you want to create an unscheduled report, Make Sure this check box is not checked.
Set the report period, report type, report date, and any email addresses you want to receive the report here.
This post will explain how to use the Bills plugin.
It is important to note that for the Bills plugin to work, your Rate Settings must have been set up first. You can find the How-to for that Here.
Finally, this plugin is for informational purposes only. The actual bill will be provided by your electrical utility.
Instructions:
Click on the icon in the lower left of the My.Eyedro.com display. This is the plugin menu.
Select Bills.
Select the Display Group you wish to view from the dropdown menu.
The Billing History graph shows the current month’s usage as well as the past 11 months usage in kWh. Hover your mouse over a month’s bar to see the amount used.
The Daily Cost (Total) graph shows a daily breakdown of costs in dollars for the currently selected billing period.
Billing period start and end dates can be adjusted. Click on the pencil icon to access settings. You can refresh the graph with the button next to the pencil.
Bill To Date shows all consumption and costs for this billing period to date.
The Est. shows the estimated cost for this billing period based on historical usage data.
Click the + in both grids to see the breakdown of other fees.
This post will explain how to use the Net Meter Plugin in My.Eyedro.com.
Instructions:
Click the icon in the lower left corner.
Click the Net Meter option.
Default settings are generation and consumption are not inverted, consumption is net is true, and show net in graph is true.
While setting up your sensors, ensure that you know which sensors are on your Main lines, and which are on the output of the solar system. Typically the values coming from Main should be positive, while the values coming from solar should be negative (representing negative consumption.)
Set up Display Groups that reflect this, ie. Display group A has sensors A and B in it and is named Mains, and Display group B has sensors C and D in it and is named Solar.
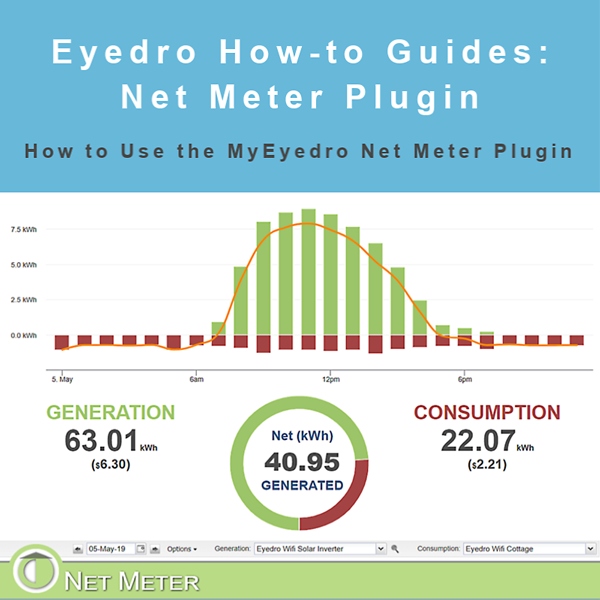
Hovering the mouse over the graph will display hourly Generation, Consumption & Net details in kWh.
Generation kWh will be on the left. If you have set up your rates the amount earned will be listed. Below the generation number is the live generation value.
Consumption kWh will be on the right. If you have set up your rates, the cost of consumption will be listed. Below the consumption number is the live consumption value.
In the center is the Net kWh either consumed or generated for the day.