
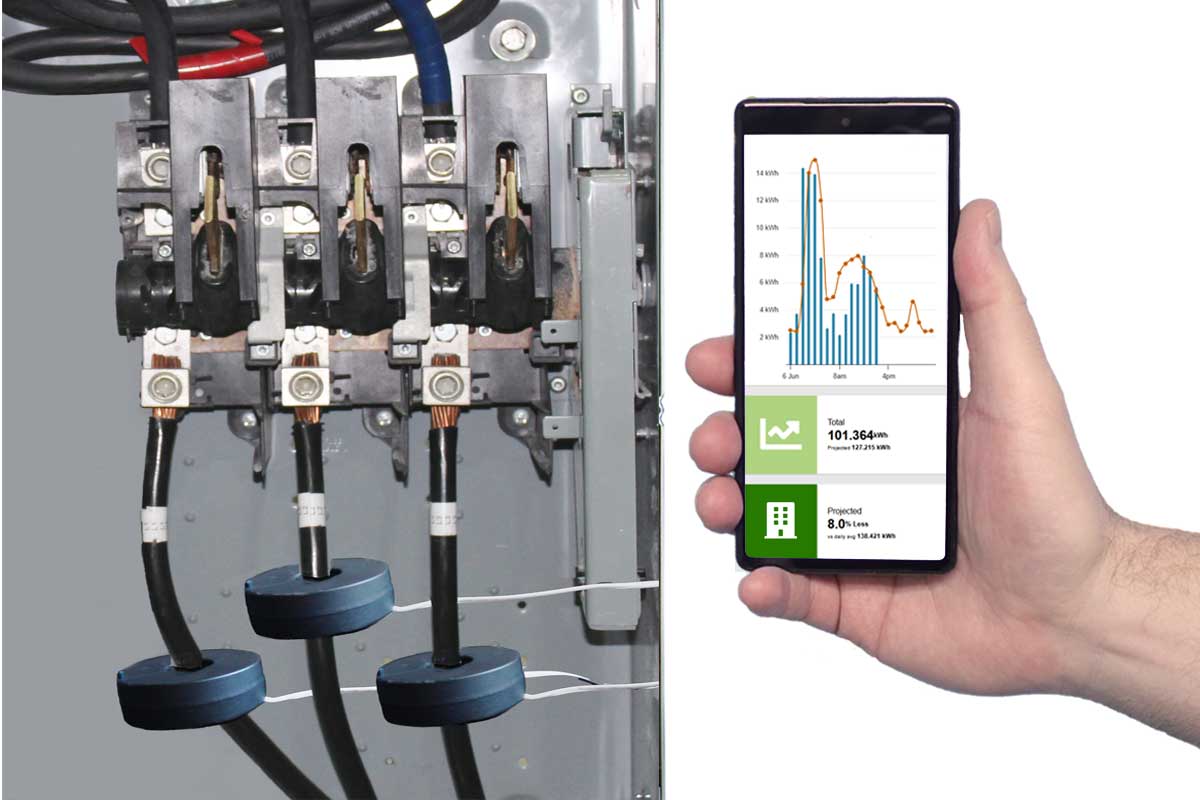
All Eyedro electricity monitors are designed to use the FREE MyEyedro.com electricity monitoring cloud service right out of the box. Just connect Eyedro to the internet and it instantly starts logging your electricity data to MyEyedro with zero additional cost to you!
Eyedro and MyEyedro are always working together to measure, analyze and store your electricity usage and cost information. The MyEyedro electricity monitoring cloud service presents your electricity data in ways that are engaging, informative and easy to understand. See real-time electricity usage and gain access to many helpful features that help you uncover waste, manage costs and take control of your electricity use.

Existing users can access the MyEyedro Cloud dashboard via https://my.eyedro.com.
Take control of your energy bill
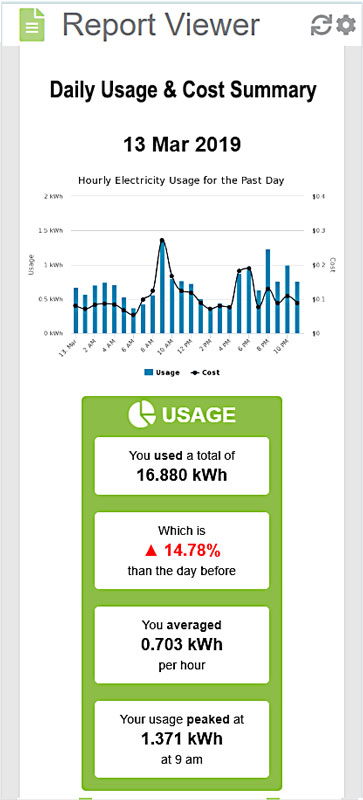
Track daily usage and costs
Identify energy-hungry appliances
Set savings goals with real-time data
Recommended: Highlights Plugin + Consumption
Optimize operations and reduce costs
Monitor multiple circuits or zones
Analyze usage trends over time
Improve efficiency across locations
Recommended: Demand Live + Bills
Prevent costly demand spikes
Real-time demand monitoring
Detect peak load events instantly
Support energy management strategies
Recommended: Demand Live Plugin
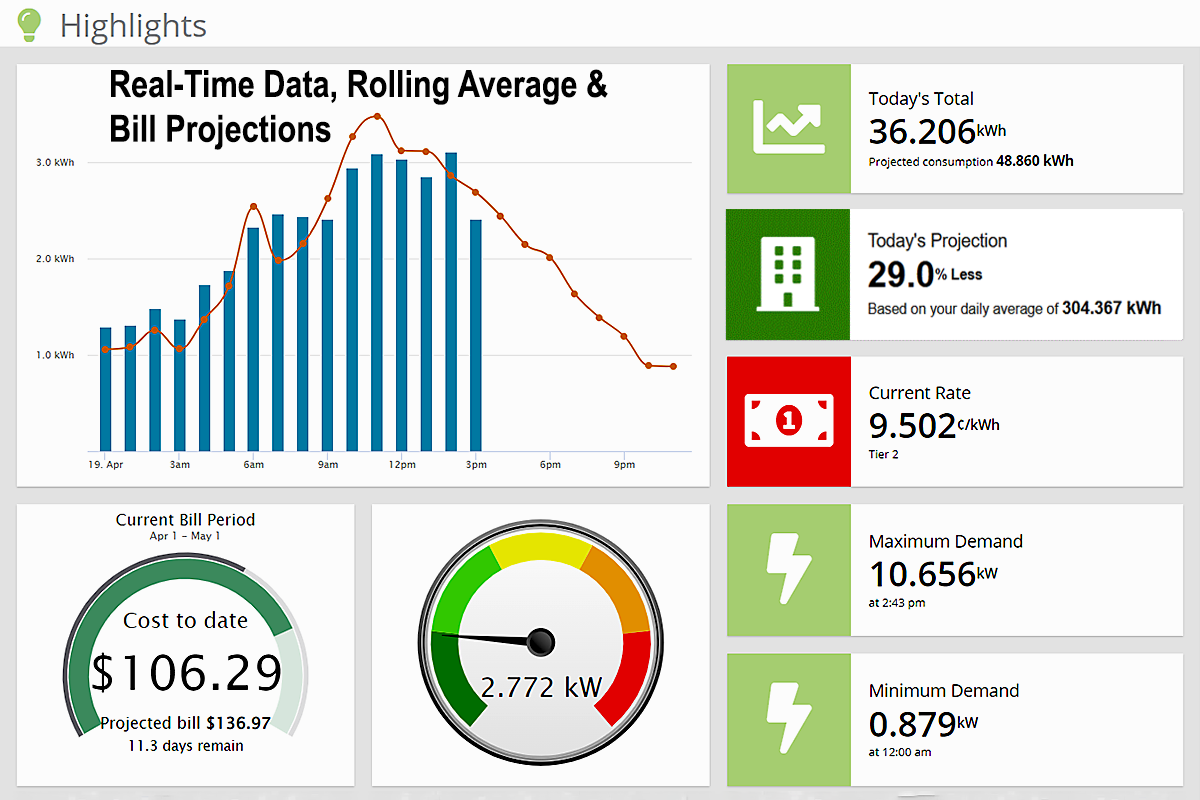
Smart Budget Forecasting: Take the guesswork out of utilities with live bill estimates and daily projections that track your spending to the cent.
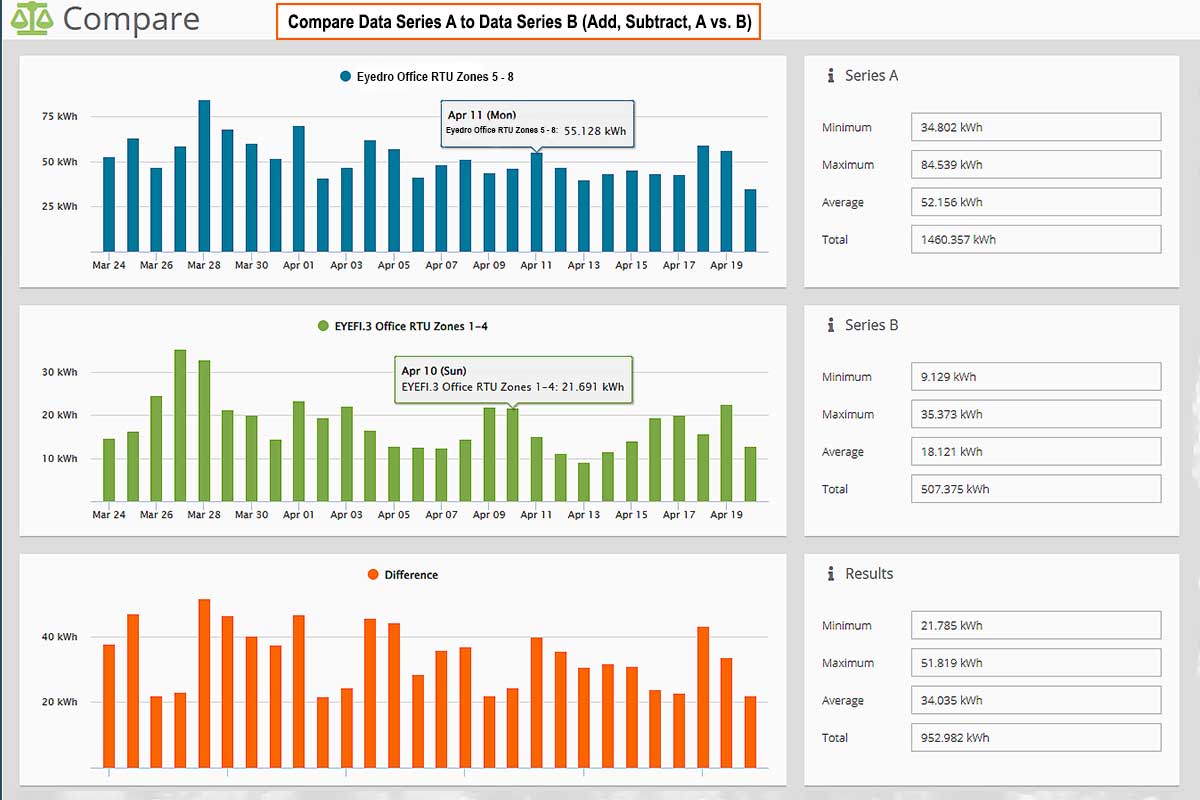
Data-Driven Comparisons: Analyze hourly consumption trends across multiple meters and benchmark your performance
Precision Deep-Dives: Explore your energy history with a Detailed Timeline Graph that lets you highlight and zoom into specific regions for granular, sensor-level analysis.
Centralized Insights Grid: Instantly identify trends with a Details Grid that acts as both a visual legend and a real-time scoreboard for your latest sensor readings and value changes.
Seamless Historical Navigation: Use the Master Timeline to scan a full week of aggregate data, then simply click any point of interest to instantly populate the detailed view for a closer look.
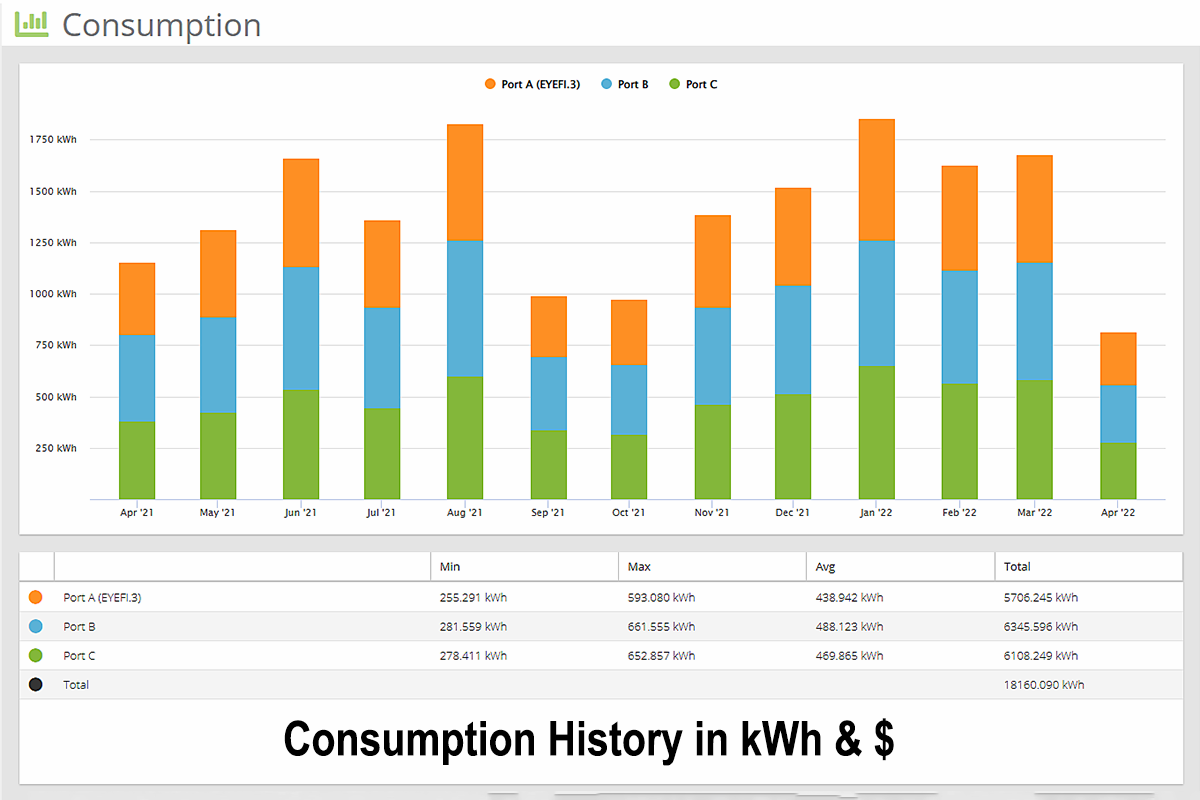
Customizable Usage Intervals: Tailor your view with a Consumption Graph that breaks down cost and energy data by the hour, day, week, or month for every sensor in your group.
Integrated Performance Metrics: Eliminate the guesswork with a Statistics Grid that serves as both a visual legend and a real-time data hub for your graph’s most critical figures.
Instant Statistical Overviews: Get the “big picture” immediately with Automated Statistics that calculate and display the core metrics of your current data view.
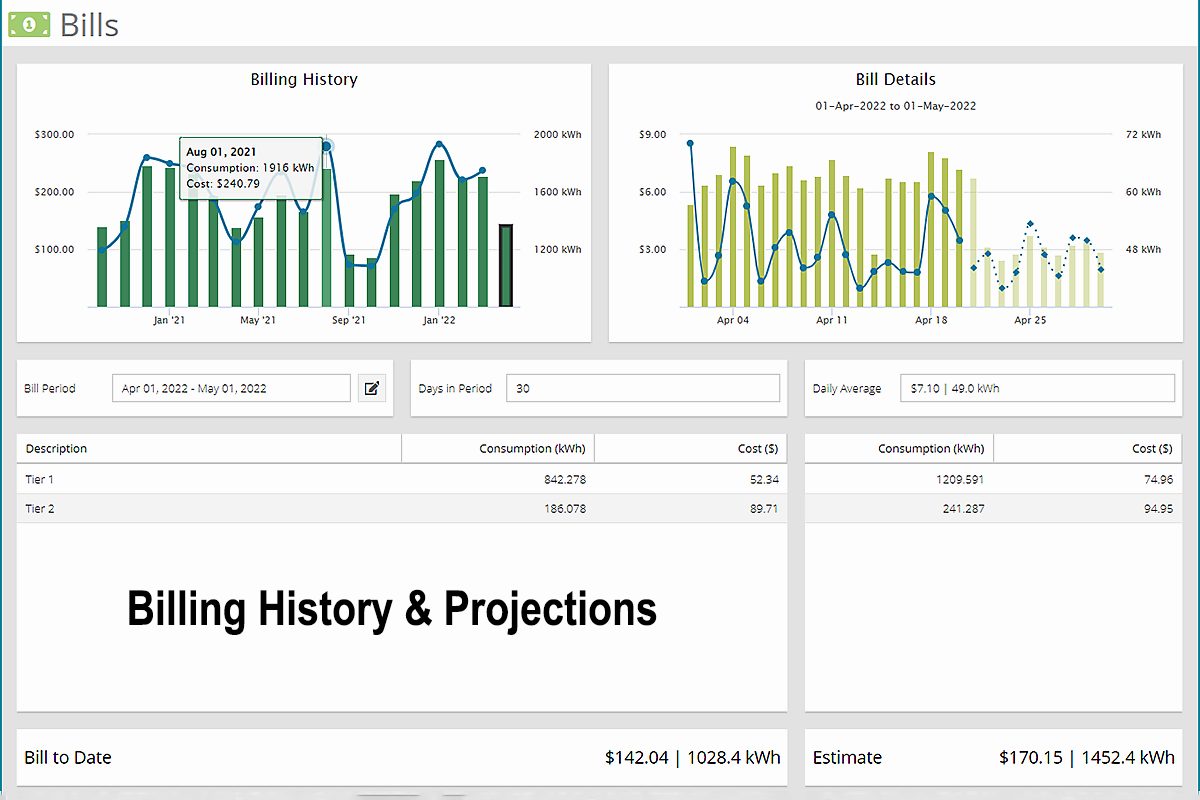
Comprehensive Billing Intelligence: Seamlessly navigate your financial history with a Billing History Graph that tracks cost and consumption across multiple periods for easy year-over-year comparisons.
Predictive Financial Forecasting: Take the surprise out of your utility statement with Estimated Bill Totals that use your historical data and current pace to project your final month-end costs.
Drill-Down Daily Breakdowns: Transform a single bill into actionable insights by clicking any period to view Daily Bill Details, featuring interactive tooltips that reveal exact cost and usage spikes.
Advanced Cost Transparency: Access a complete Billing Period Summary—including average daily spend, rate-based breakdowns, and total consumption—to understand exactly how your money is being spent.
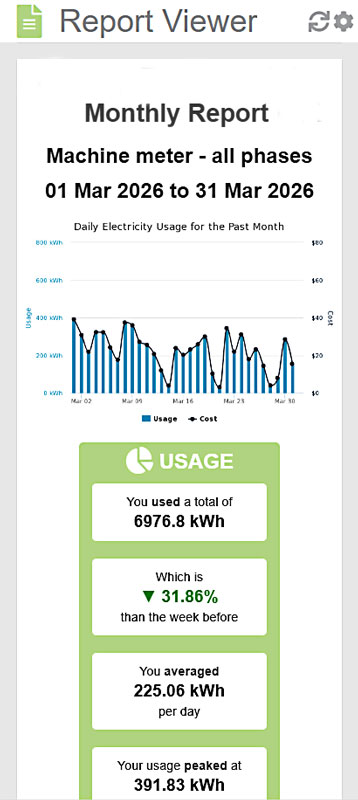
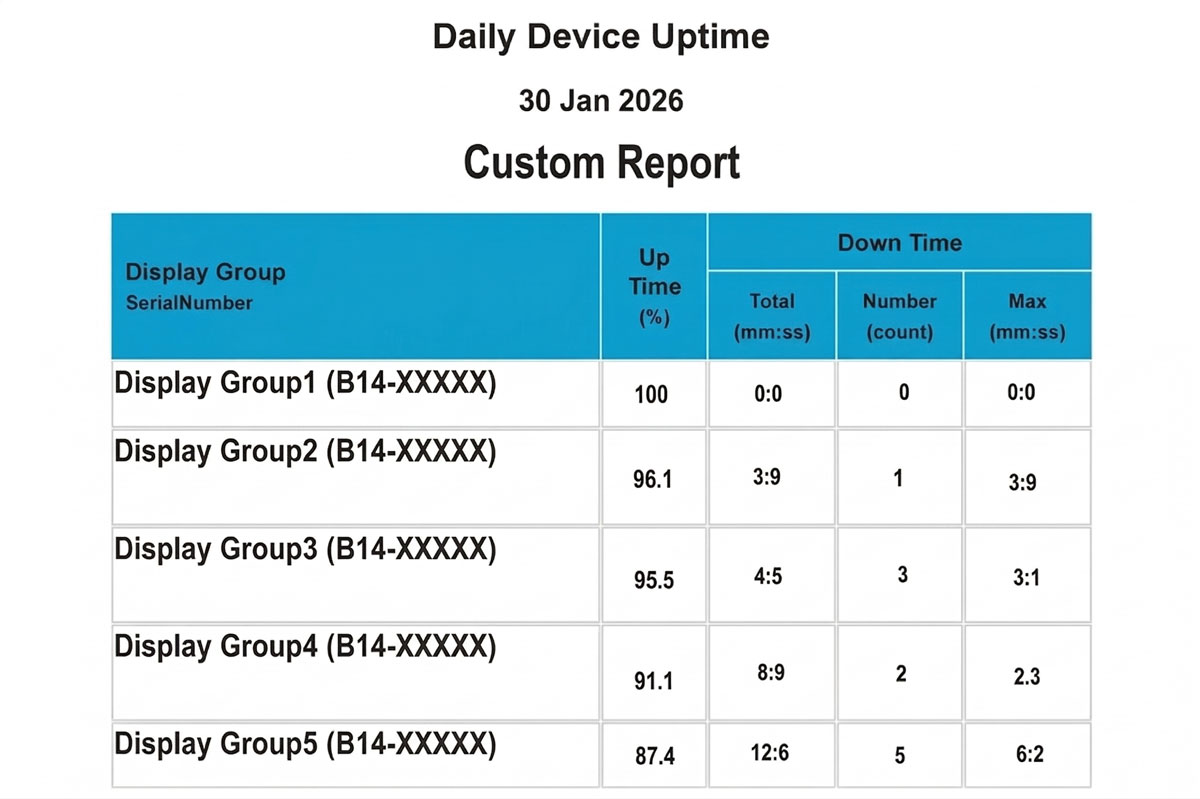
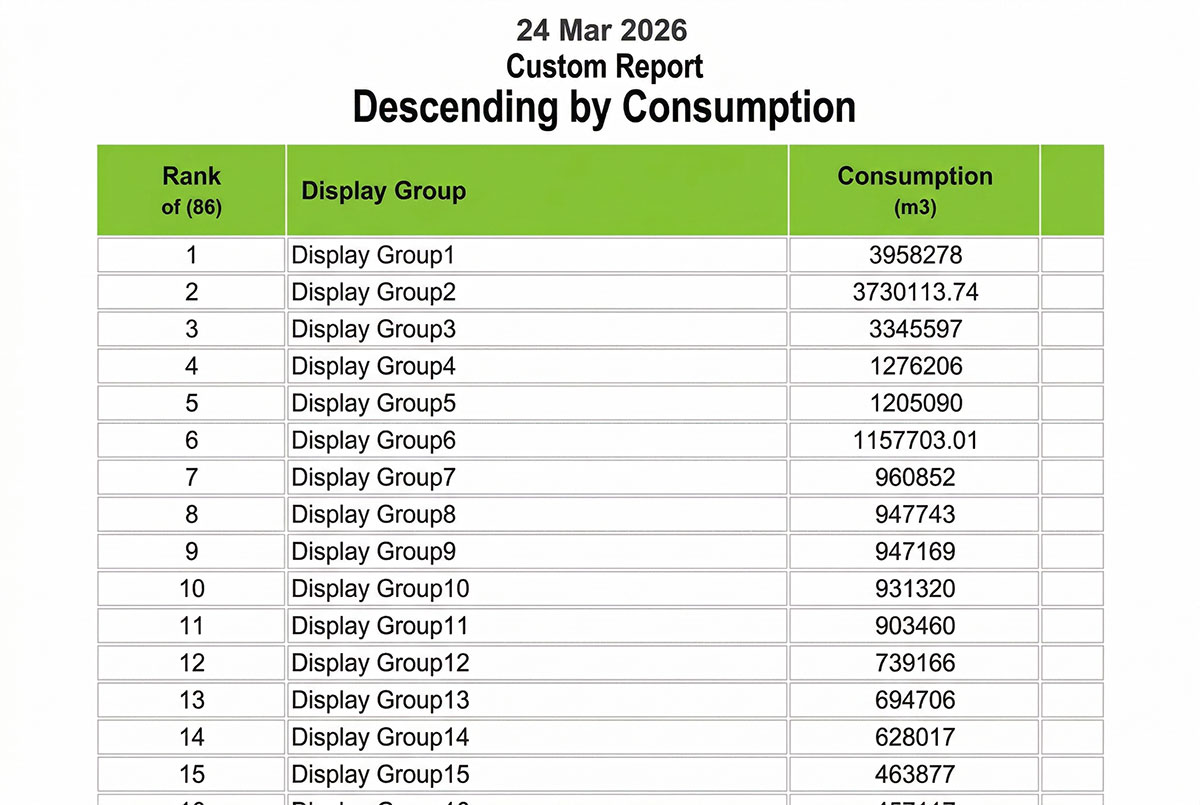
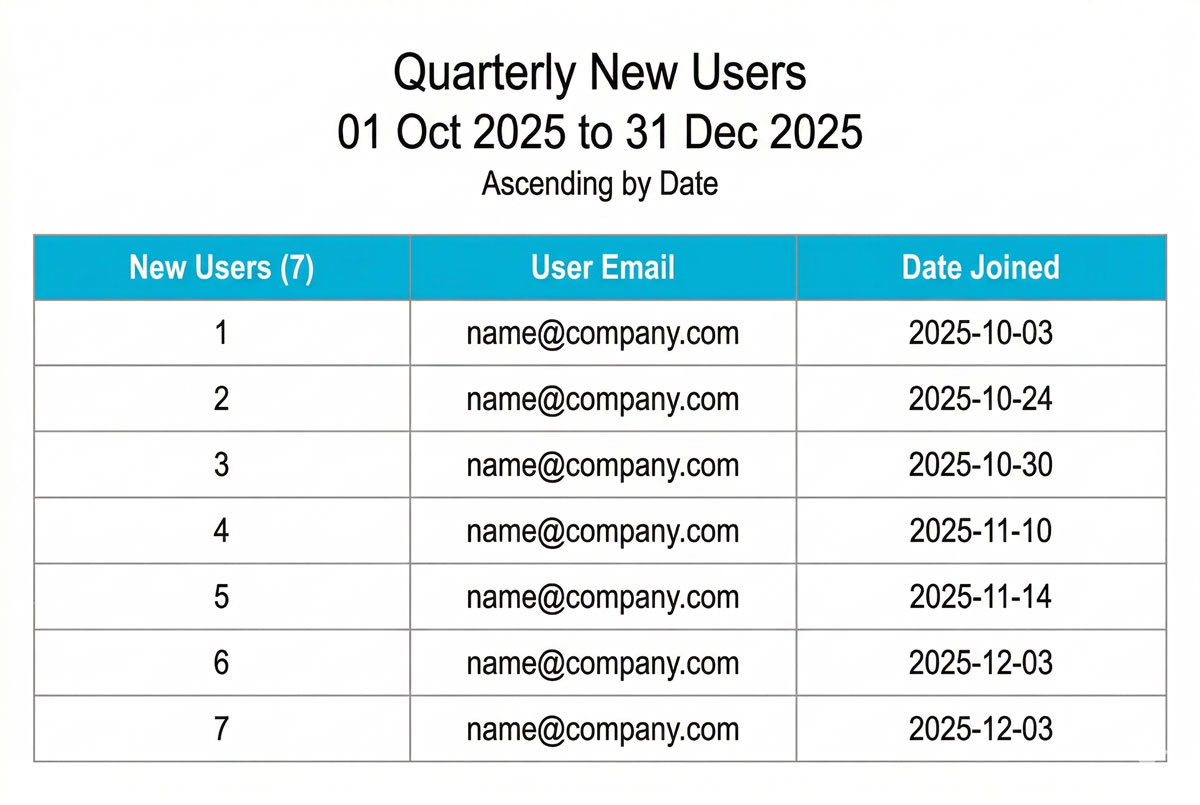
Tailored Reporting Profiles: Effortlessly manage and view custom-built Report Profiles that store your specific data preferences for instant, one-click access to the metrics that matter most.
Flexible Scheduling & Archiving: Seamlessly navigate between scheduled and on-demand reports to review historical performance or capture a snapshot of your current energy footprint.
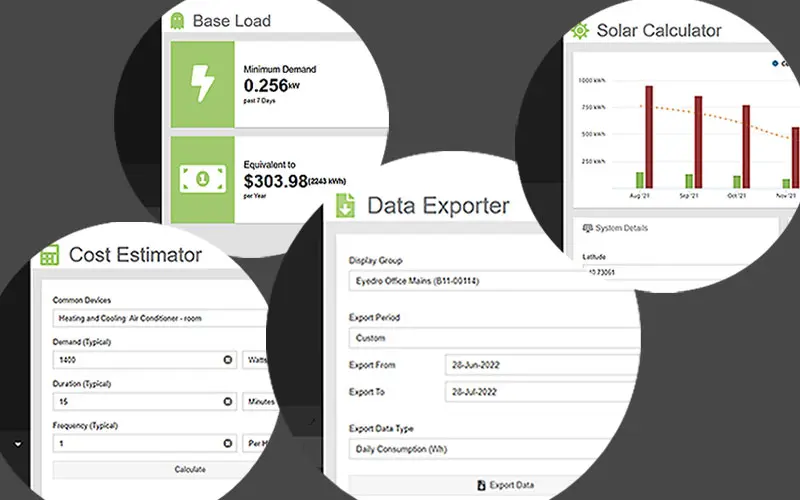
Seamless Data Distribution: Take your insights anywhere with Multi-Channel Export Tools—instantly print, email to stakeholders, or download raw data as a .CSV for advanced external analysis.
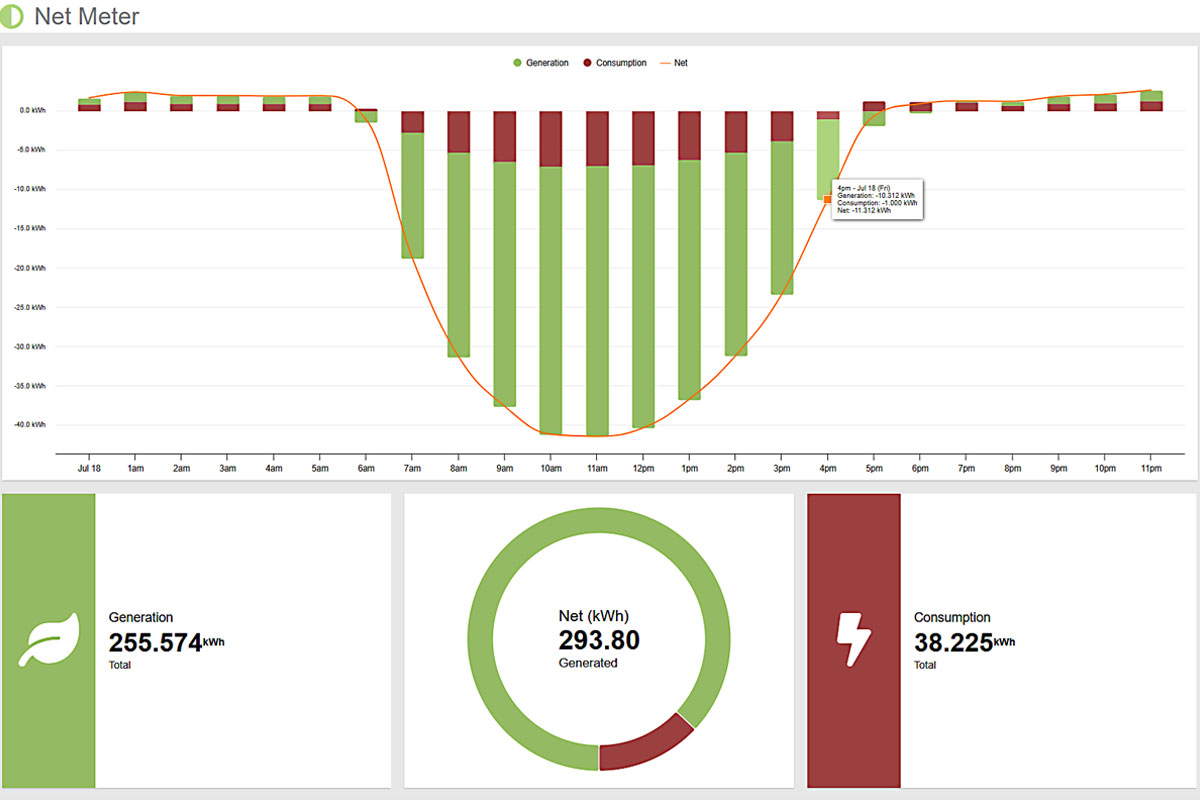
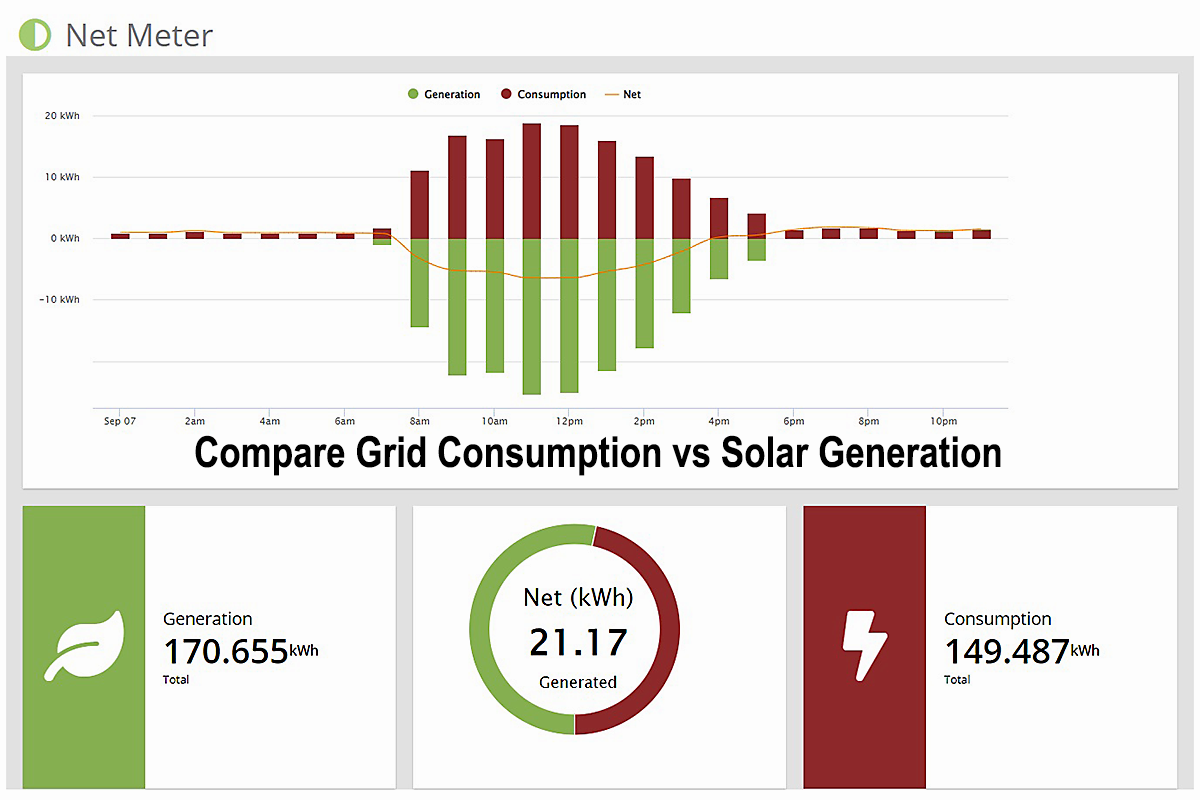
Holistic Energy Visualization: Master your energy ecosystem with a high-impact Net Graph that color-codes solar or wind generation, consumption, and net usage for an instant picture of your efficiency.
Precision Net Analytics: Dive into the details with an interactive Net Pie Chart and hourly hover-states that reveal exactly how much energy you’re producing versus what you’re drawing from the grid.
Live Generation & Demand Tracking: Monitor your sustainability in real-time with dual Statistics Dashboards that display both your instantaneous power production and your current electrical demand.
Dynamic Performance Benchmarking: Side-by-side Comparison Graphs allow you to visualize consumption data across different display groups, making it easy to spot efficiencies or outliers across your entire operation.
Advanced Mathematical Insights: Go beyond simple viewing with Integrated Math Operations that automatically calculate and graph the relationship between data sets, providing instant statistical results for any selected period.
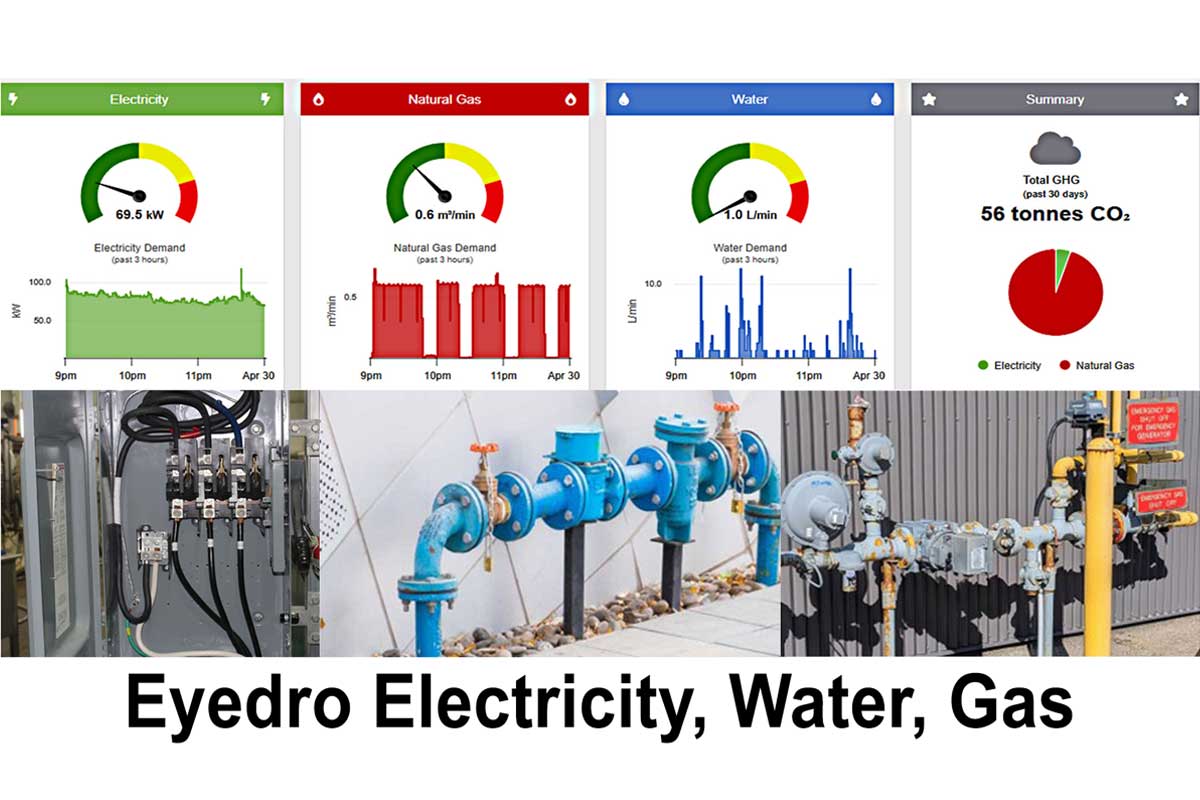
Multi-Utility Command Center: Monitor up to three distinct utility types—including electricity, water, and gas—within a single, unified Utility Dashboard for a total view of your building’s footprint.
High-Impact Visual Tracking: Combine historical trends with live data using Integrated Demand Gauges and hourly graphs that show you exactly how your consumption is shifting in real time.
Side-by-Side Site Comparisons: Effortlessly benchmark different installations or utility regions with customizable headers and color-coded regions, making it simple to spot efficiencies across your entire portfolio
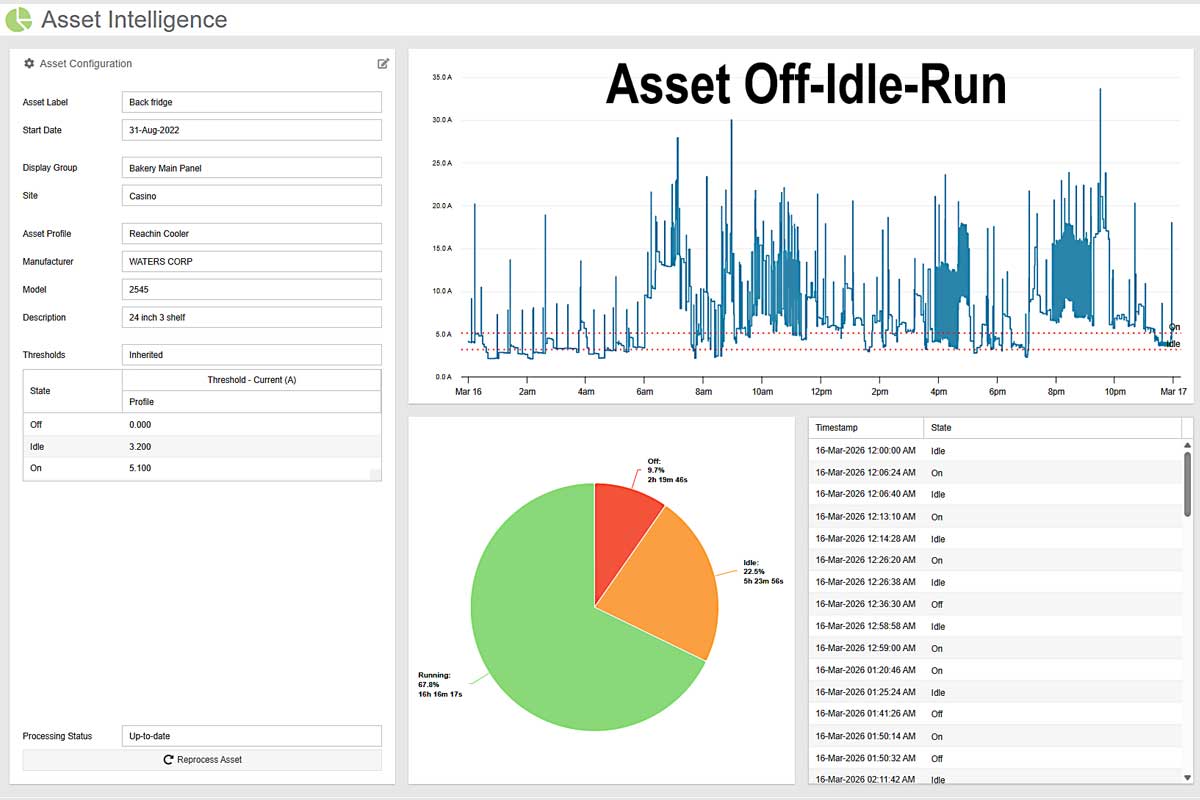
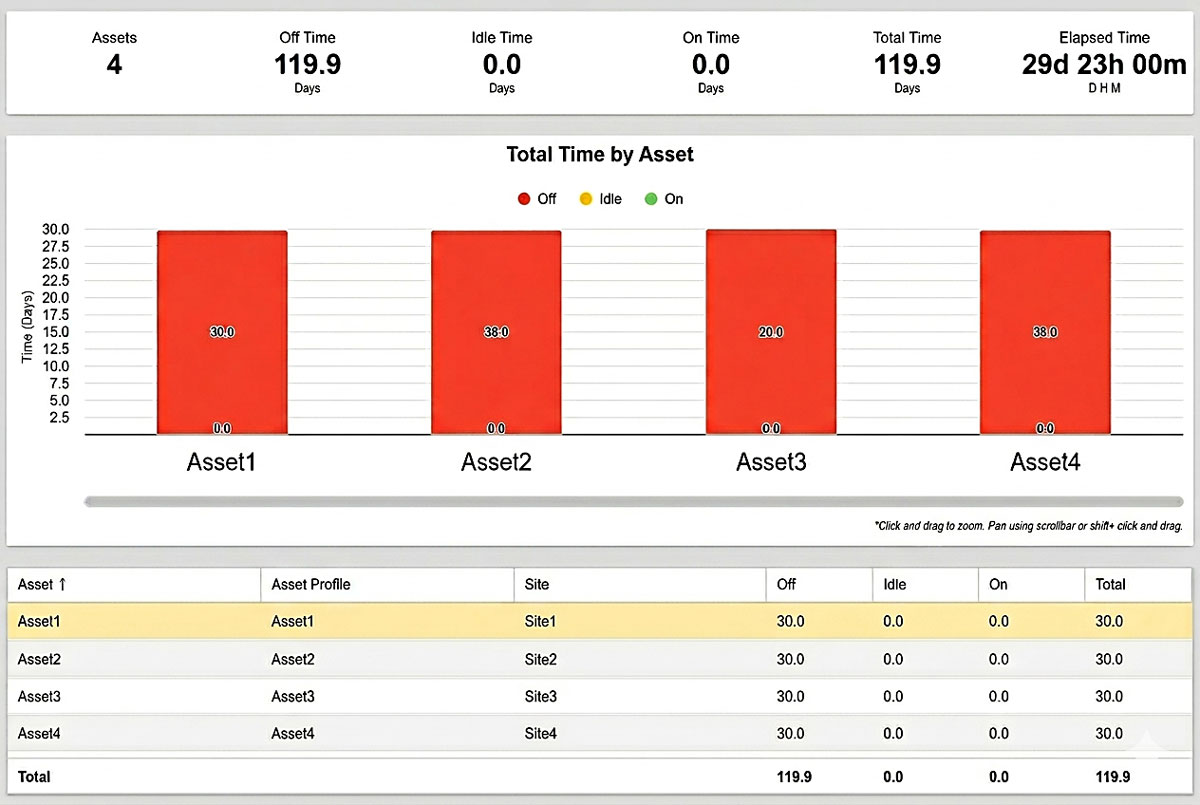
Enterprise-Scale Asset Intelligence provides deep run-state analysis for an entire fleet of machinery or lab equipment, allowing you to monitor and compare dozens of assets with shared operational profiles in one unified view.
Precision Independent Monitoring: Track every piece of equipment with surgical accuracy by utilizing isolated branch circuit monitoring or inline machine sensors to capture the unique performance data of every individual asset.
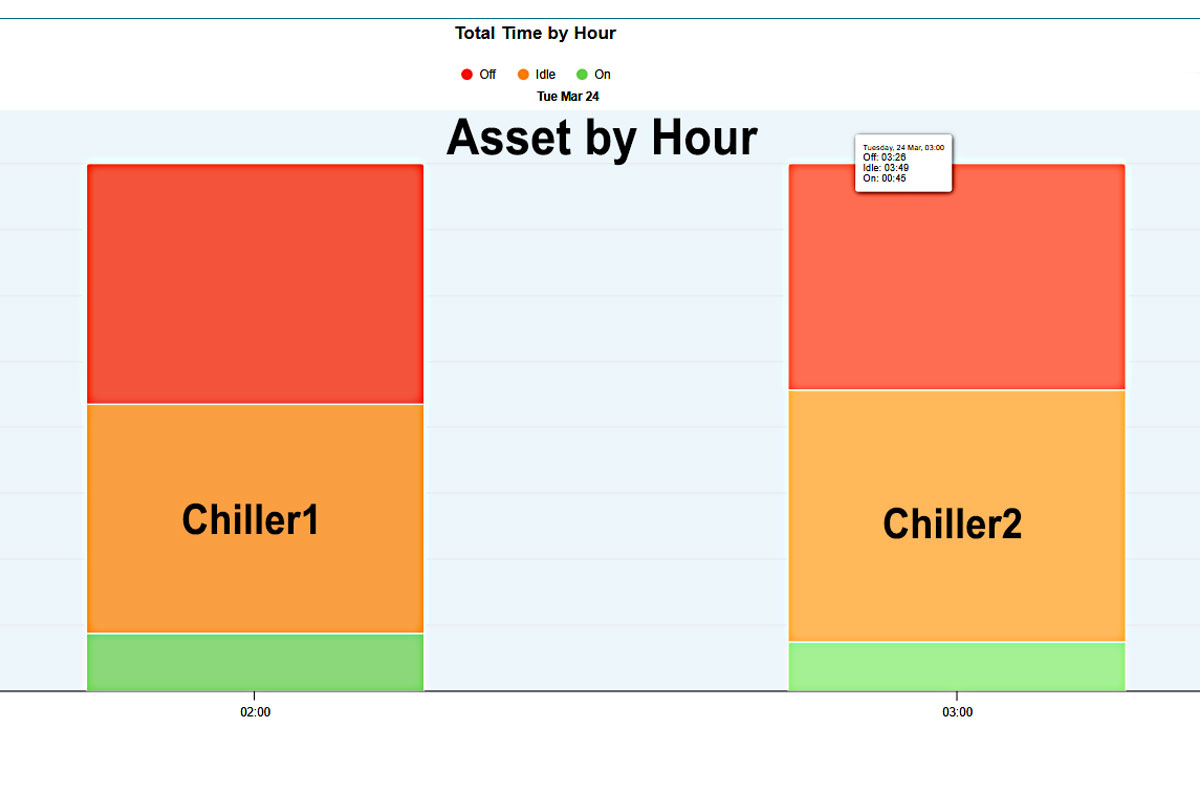
Visual Run-State Analytics: Gain total transparency into equipment behavior with a 24-Hour Run-State Graph that overlays electrical demand with customizable performance thresholds to identify peak efficiency.
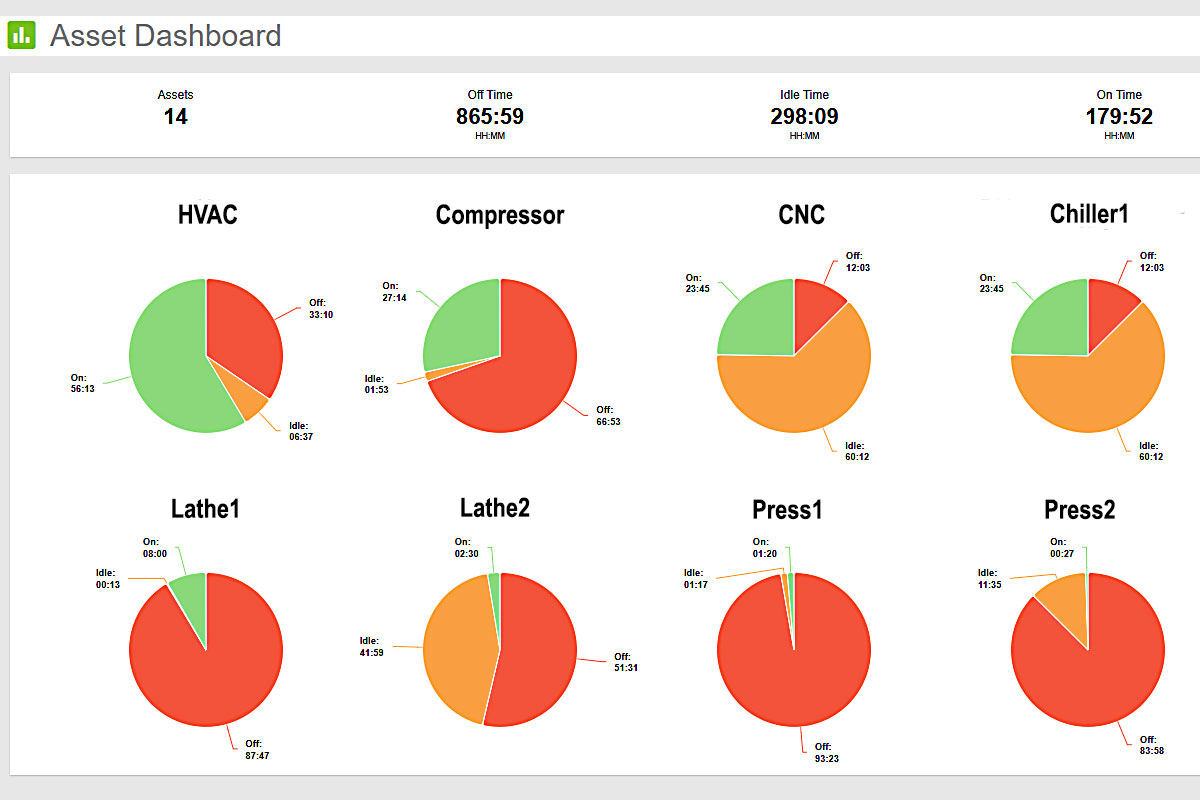
Precision Utilization Tracking: Instantly see how your assets are working with Interactive Utilization Charts that break down exactly how much time machinery spends active, idle, or off.
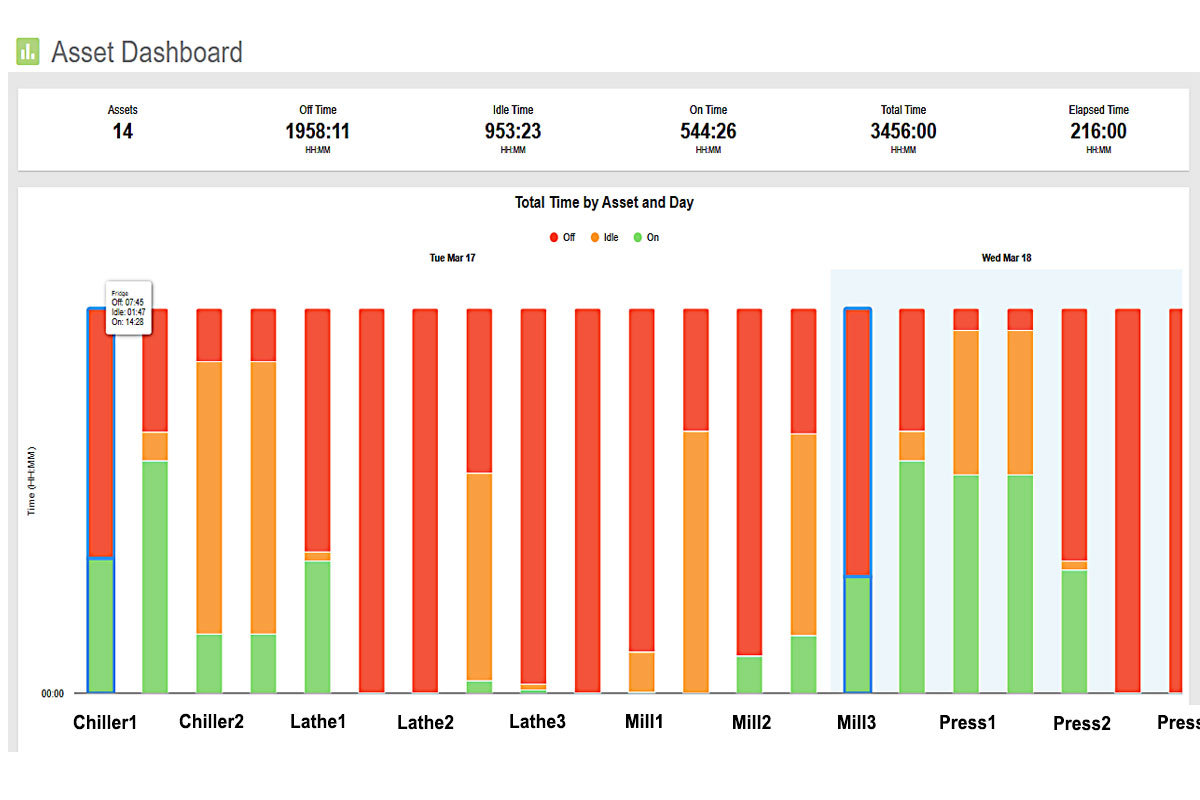
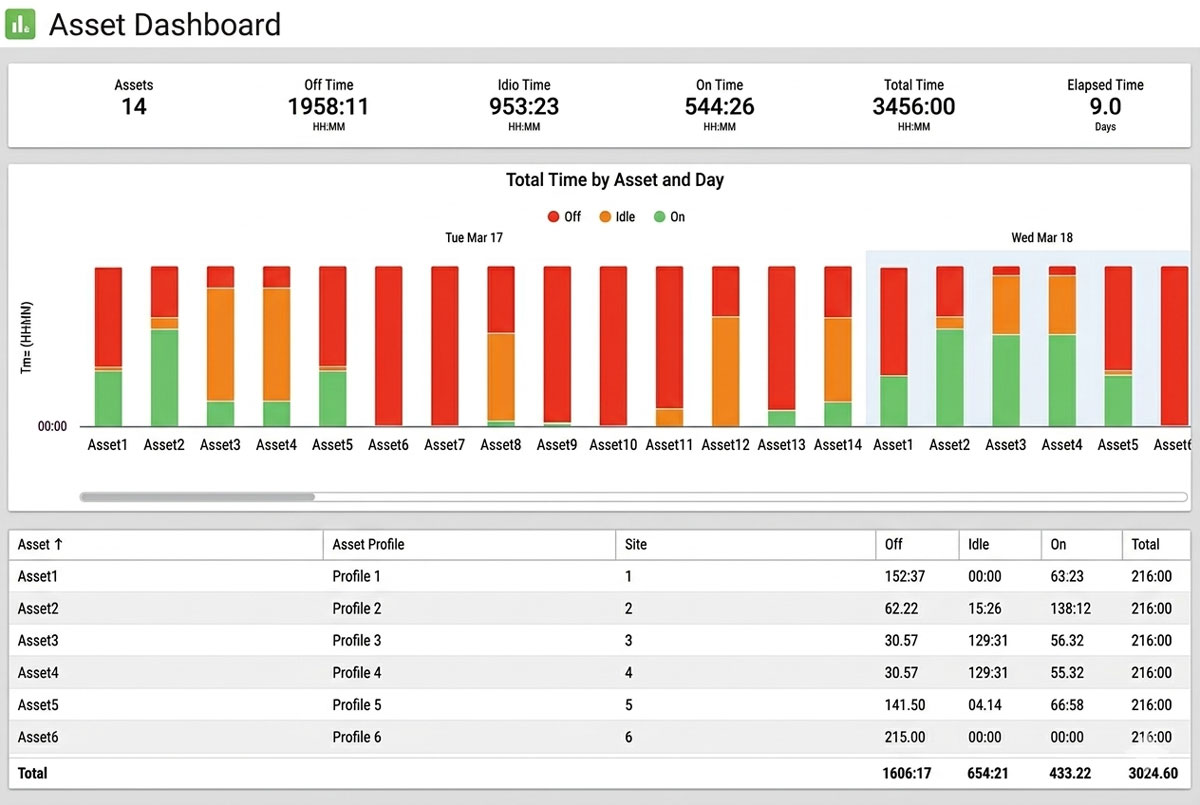
Customizable Command Center: Visualize your equipment’s performance with a User-Configurable Asset Dashboard that transforms raw run-state data into high-impact presentation formats tailored to your workflow.
Aggregated Asset Intelligence: Get the “big picture” of your entire machine floor with a Centralized Summary Panel that compiles key performance metrics from all monitored assets into a single view.
Interactive Operational Mapping: Seamlessly pivot between a high-level Asset List and detailed State Graphs to instantly identify which machines are active, idle, or requiring attention.
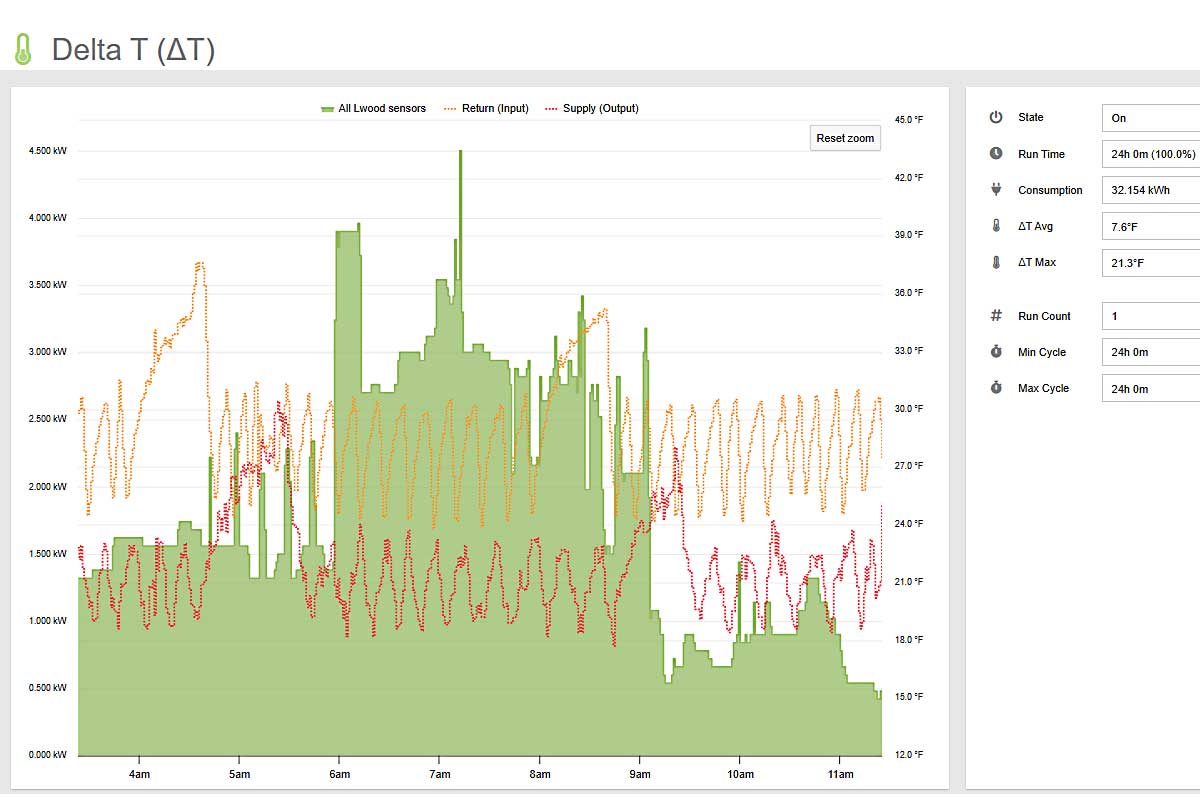
Delta T (or ΔT) is a crucial factor in determining the performance and energy efficiency of an HVAC system as a whole. A measurement outside of normal conditions, either too high or too low, can be a sign of required maintenance or even an early indicator of pending failure.
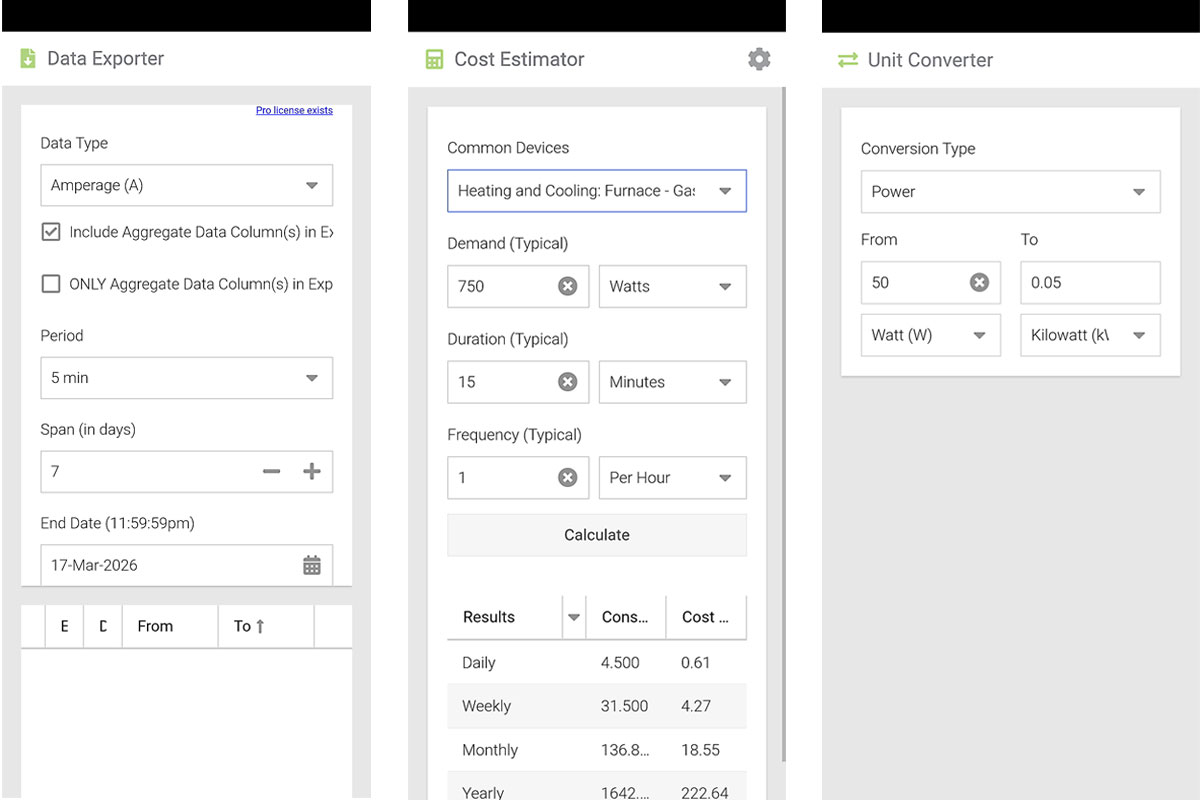
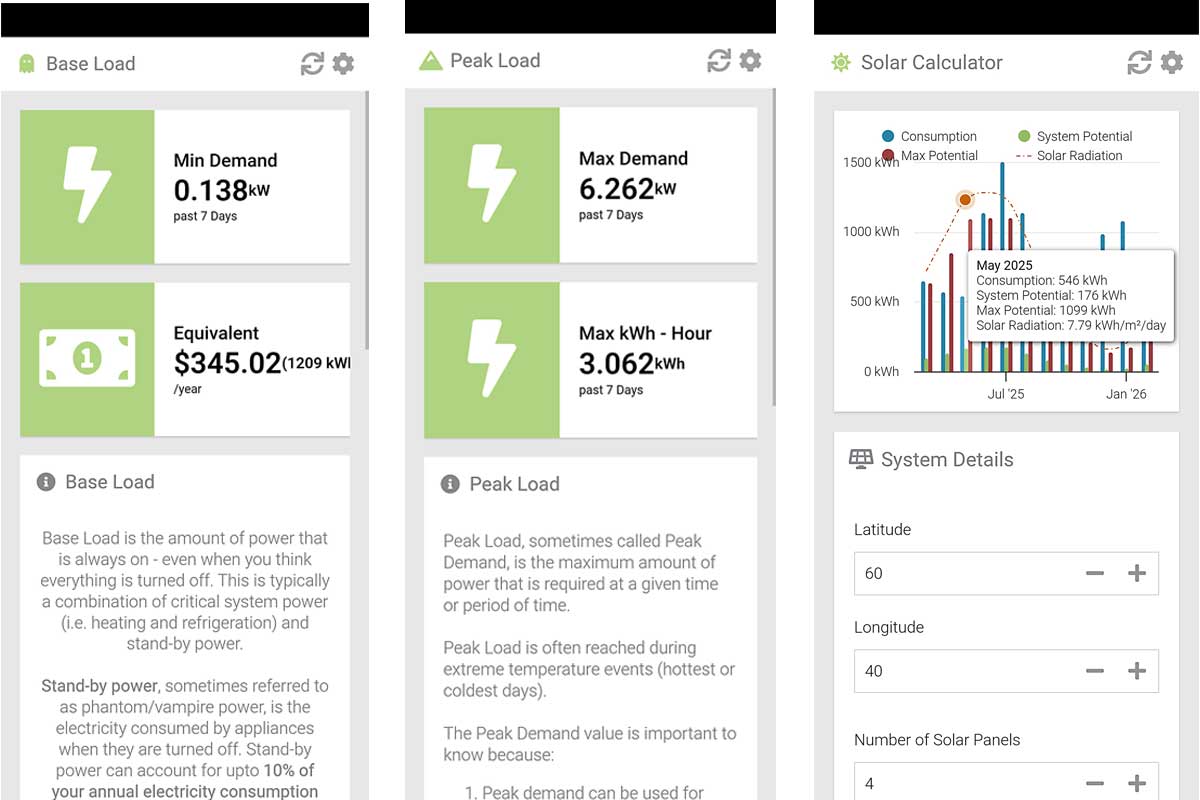
MyEyedro Tools are designed to help you quickly understand how to optimize your energy monitoring with handy insights like base and peak load.
Contact us to arrange a live demo of the MyEyedro electricity monitoring cloud service.
MyEyedro is available in three editions: MyEyedro Standard, MyEyedro Premium, and MyEyedro Pro.
Plugins
Tools
Configuration
Reports
Alerts
Integrations