MyEyedro is currently available in two editions: MyEyedro Standard, and MyEyedro Pro.
We also offer MyEyedro Enterprise solutions, custom built to meet your needs
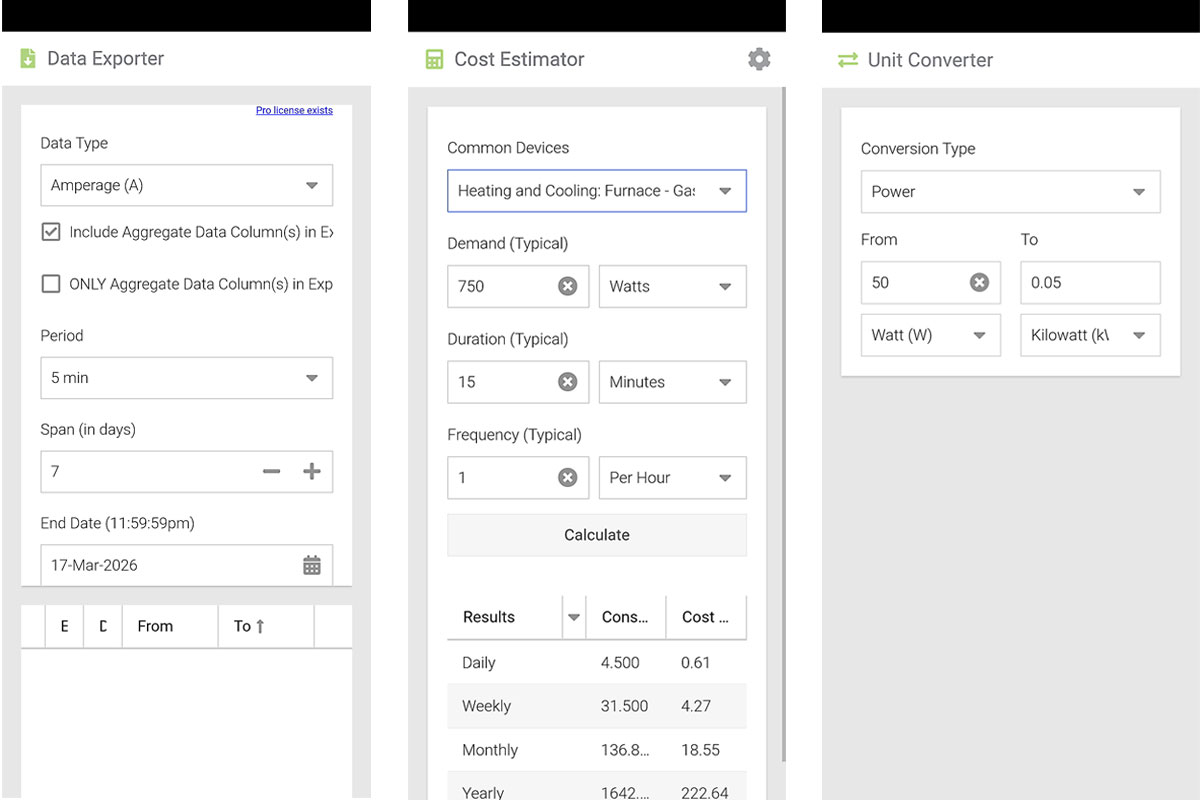
Plugins
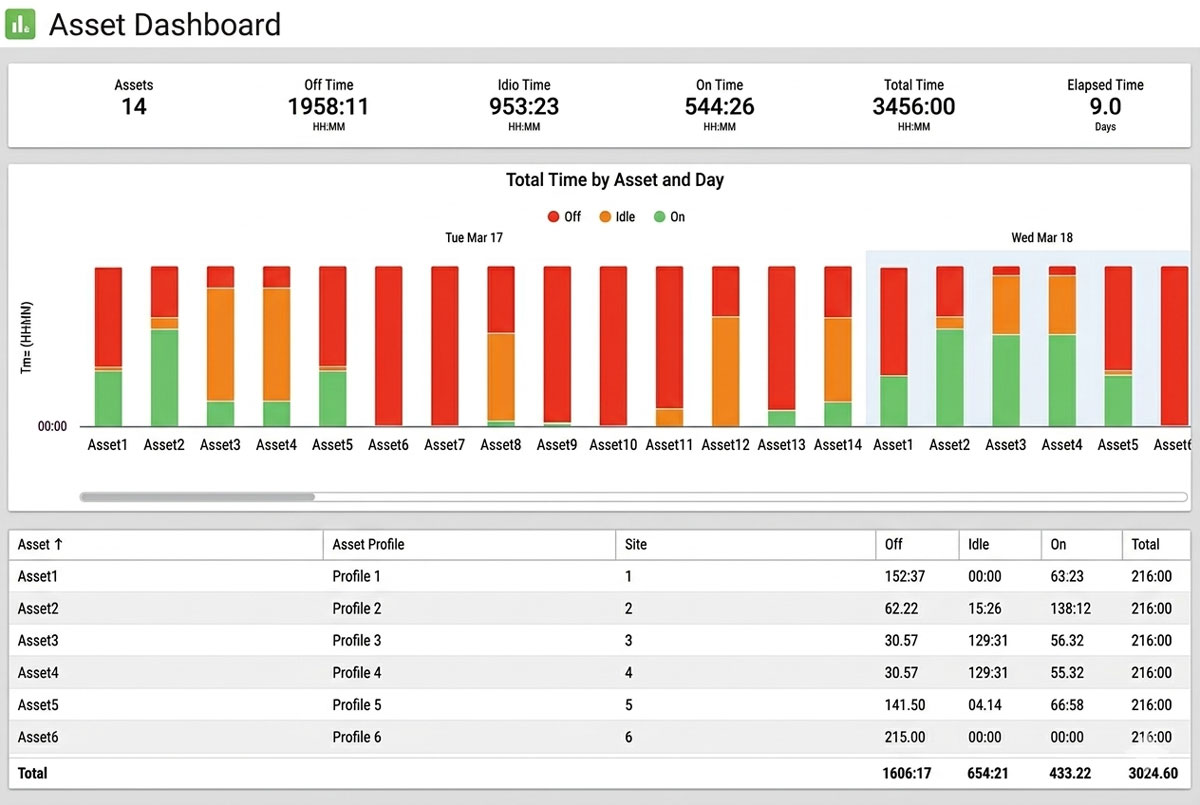
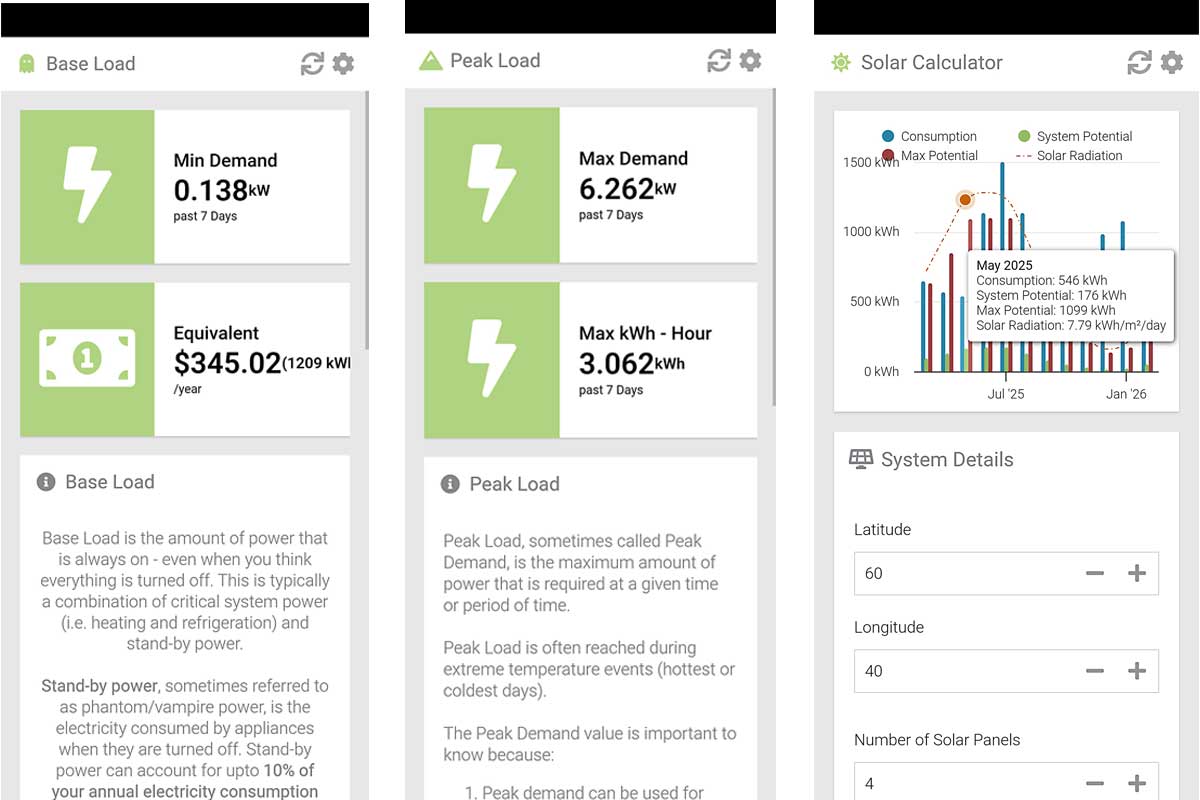
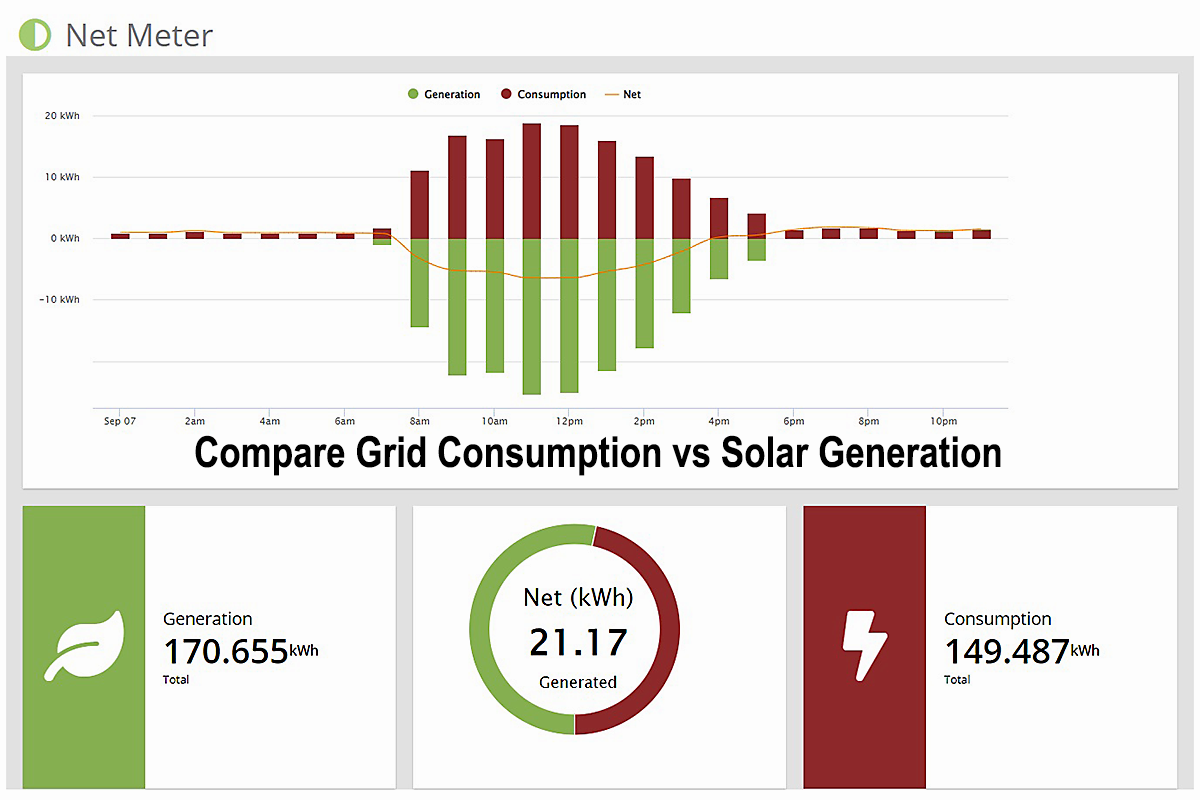
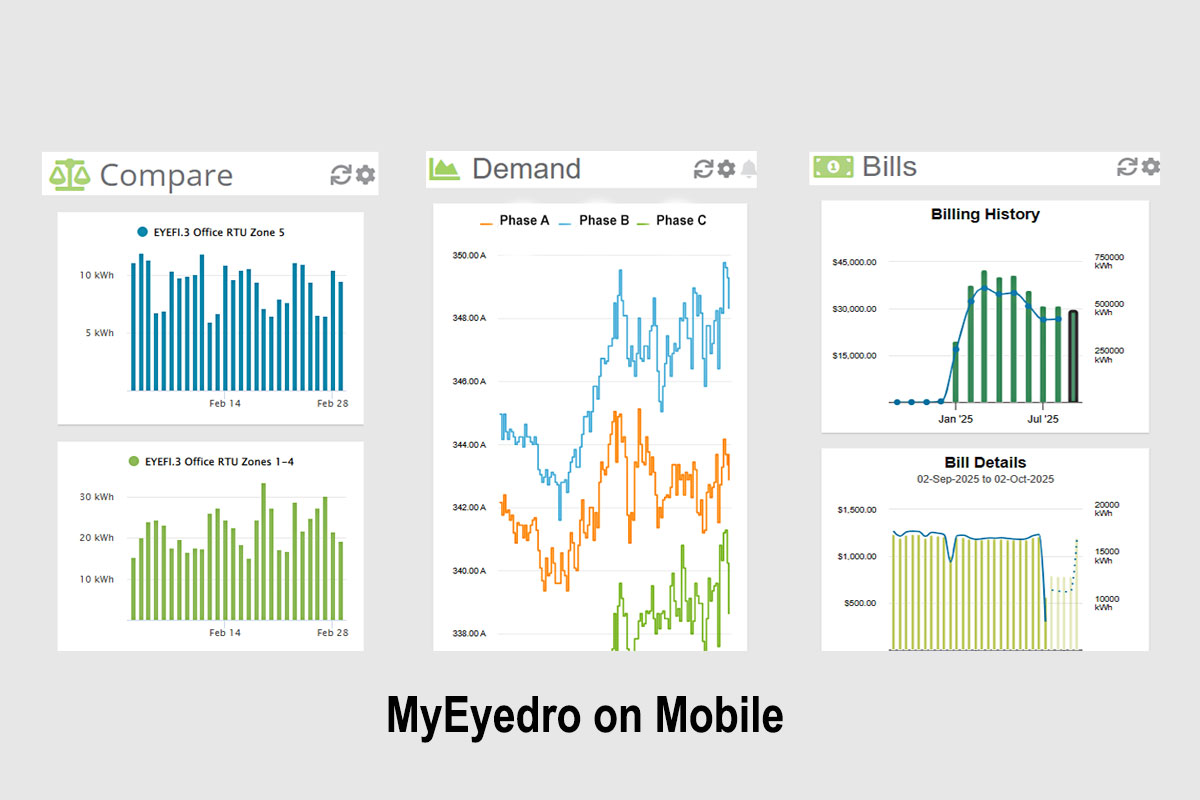
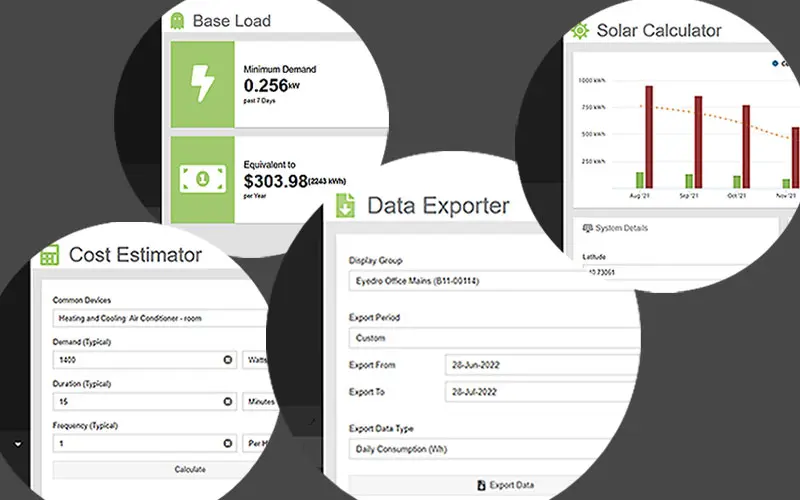
Tools
Configuration
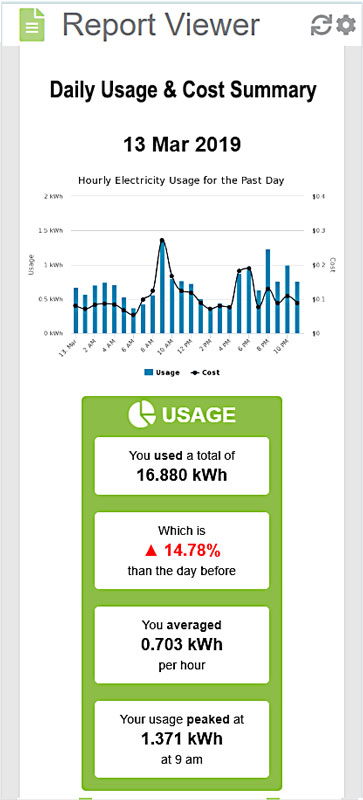
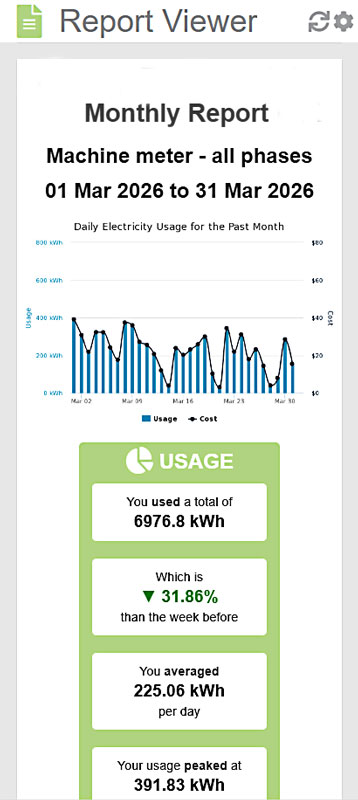
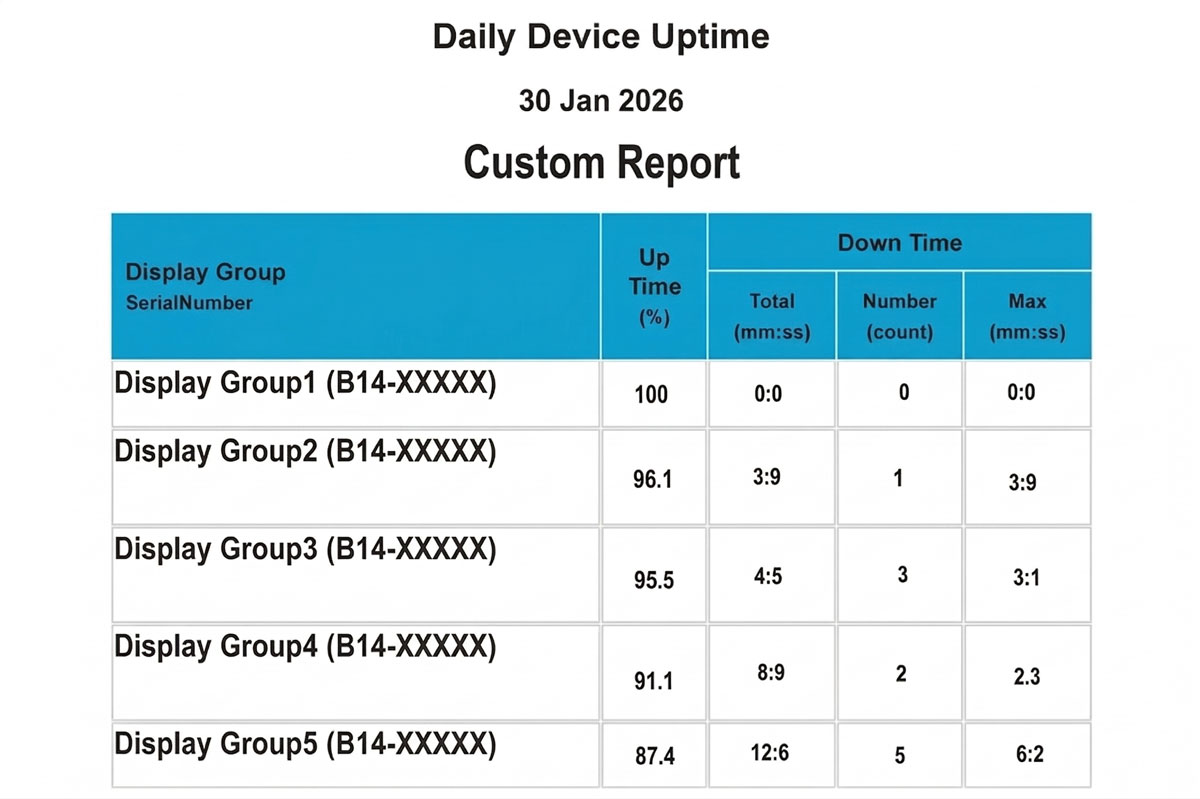
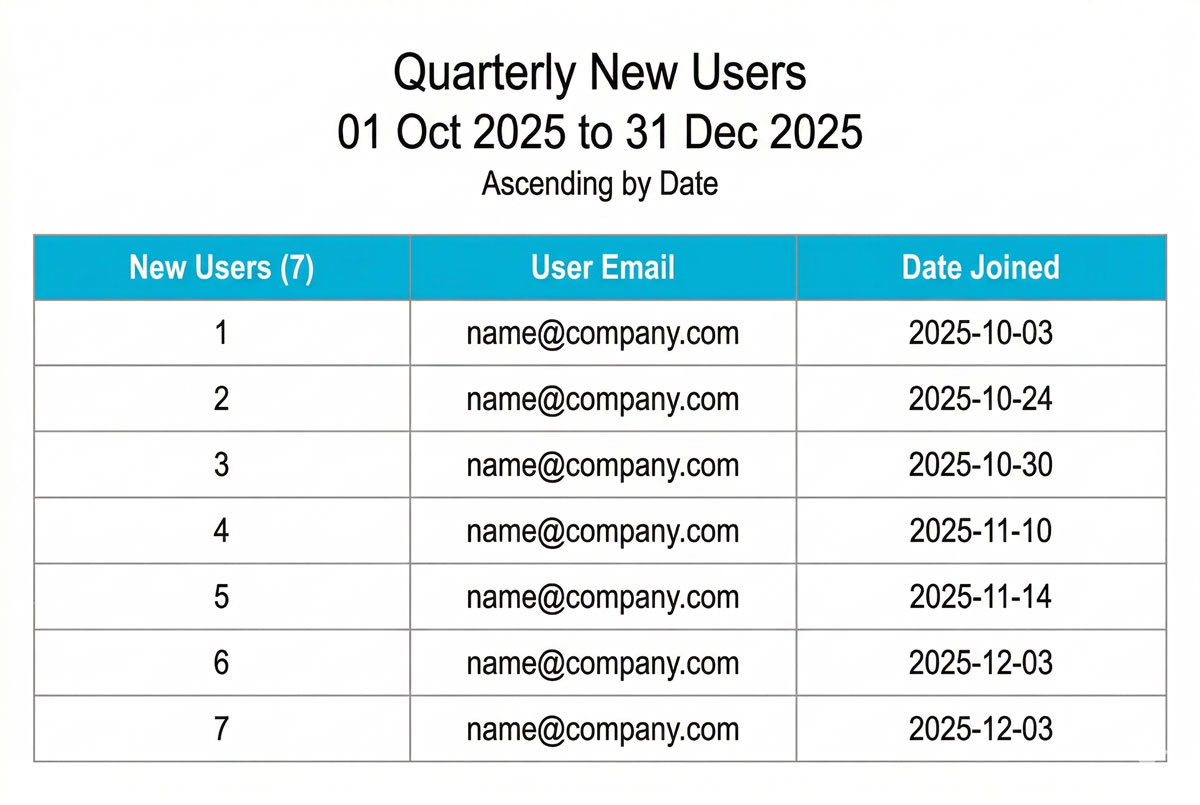
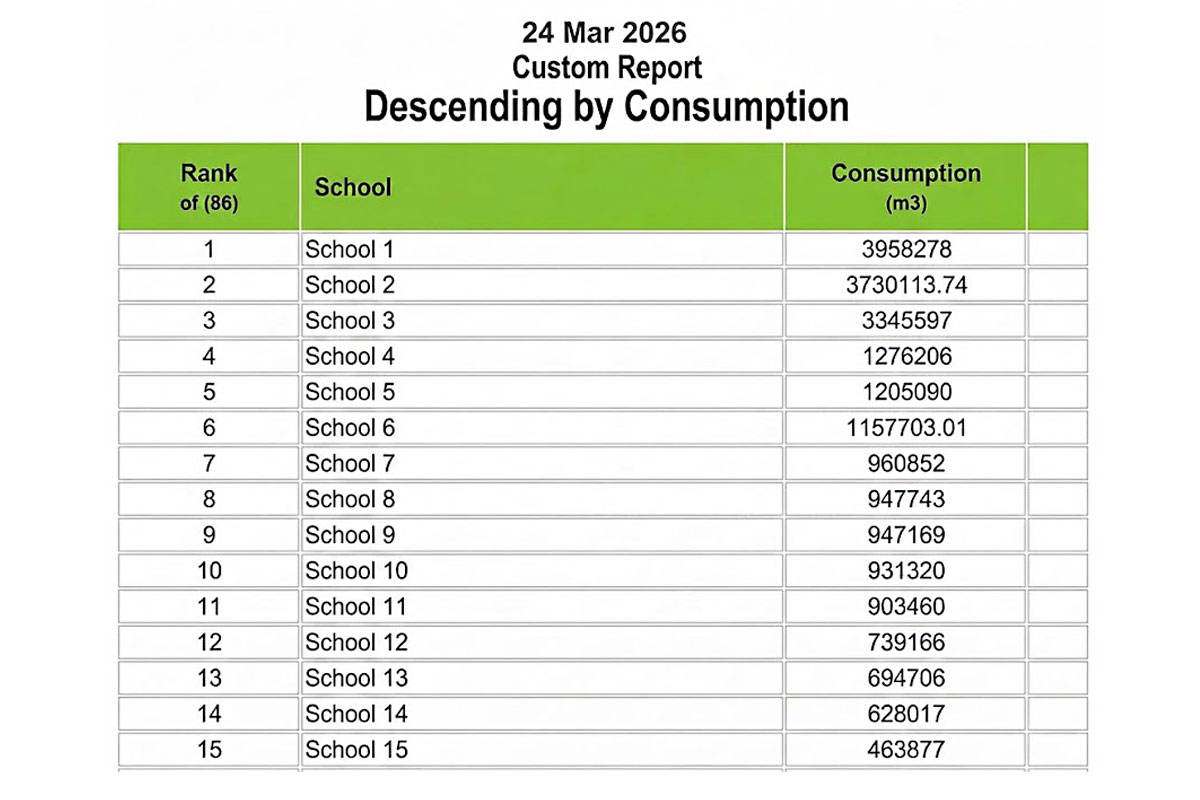
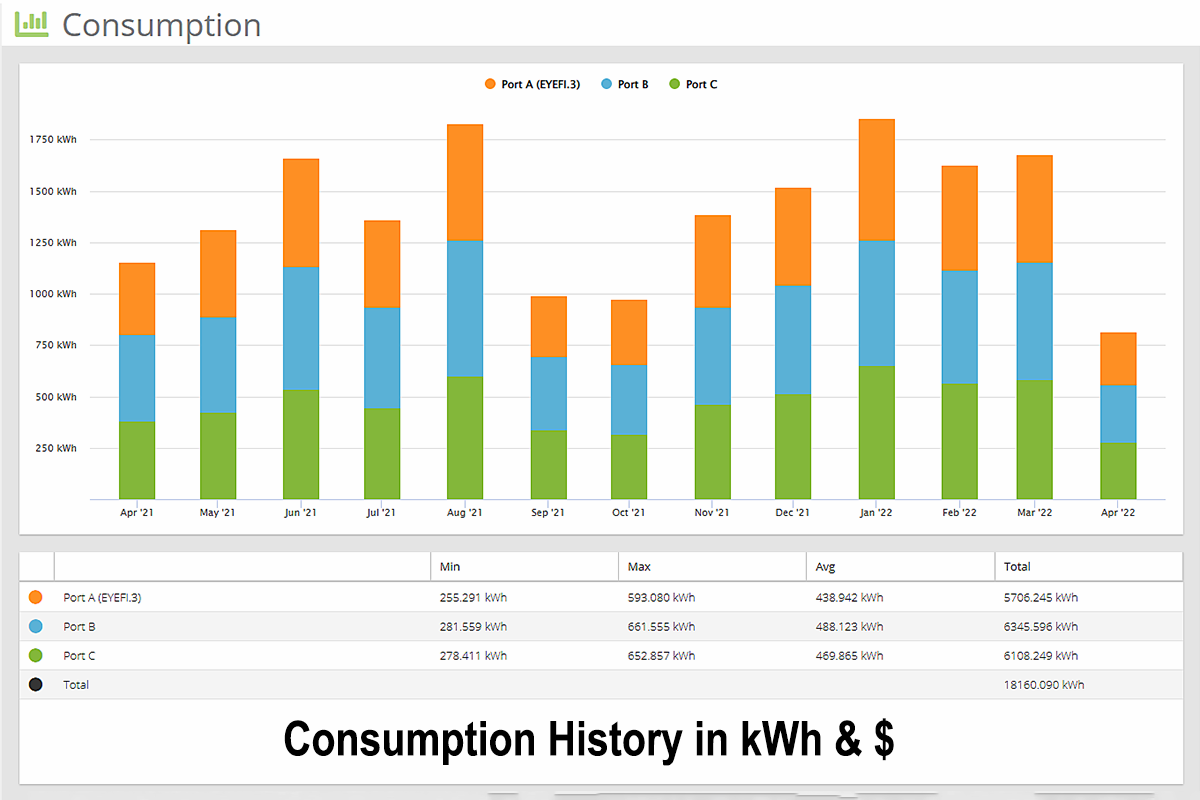
Reports
Alerts
Integrations
Support
** Enabled when one or more Eyedro for Business devices OR five or more Eyedro Home Energy Monitors are installed
1 Business hours only. To ensure you never have to sit on hold, we operate on a callback-only basis
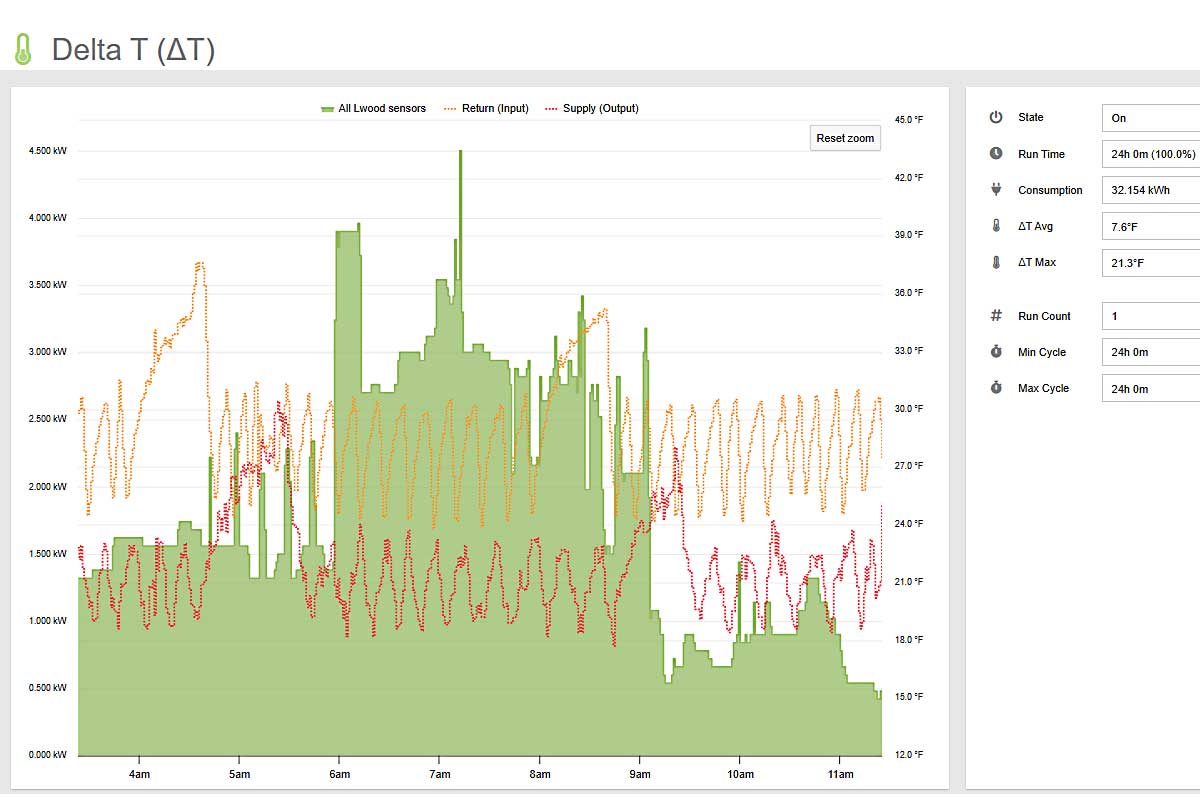
Delta T (or ΔT) is a crucial factor in determining the performance and energy efficiency of an HVAC system as a whole. A measurement outside of normal conditions, either too high or too low, can be a sign of required maintenance or even an early indicator of pending failure.