MyEyedro User Guide v4

8.1.Highlights-v4
The Highlights plugin displays convenient at-a-glance summaries of electrical consumption and estimated costs for all sensors of a specified Display Group.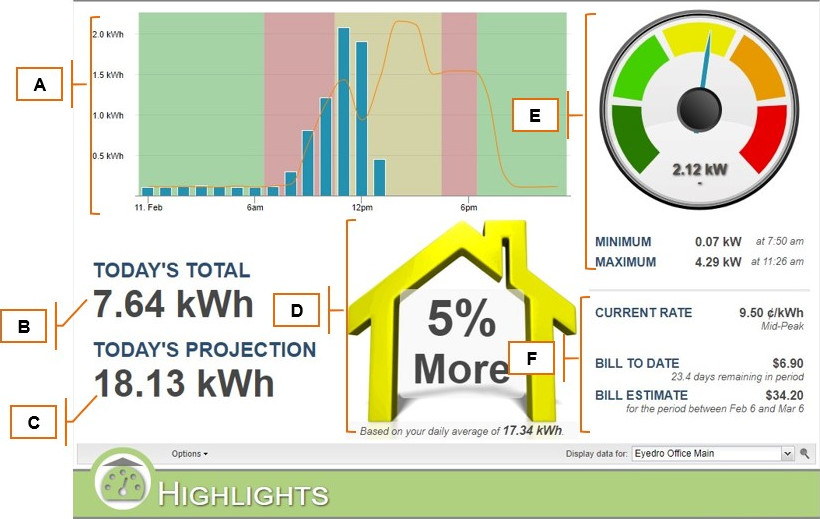
| Field | How It’s Used | |
A | Hourly Graph | The hourly cost/consumption for all sensors. Hovering your mouse over the orange line shows you the daily average. |
B | Today’s Total | The total cost/consumption of your electricity for today. |
C | Today’s Projection | The projected cost/consumption of your electricity for today. |
D | Average Demand Summary | How your data from today compares to your daily average. The daily average is based on a 4-week running average of the current weekday. |
E | Current Demand Summary | The total electrical demand at the current time, the most recent change in value, and the minimum or maximum electricity demand measured since midnight. NOTE: If displaying data as cost, the demand is multiplied by the current billing rate to determine instantaneous cost. |
F | Billing Summary | Displays billing summary data, including:
|
0 of 0 users found this section helpful