
Eyedro Case Study
Canadian Tire Saves: Eyedro Retail Case Study
Eyedro’s energy monitoring systems help Canadian Tire Red Deer identify waste and save money!

Eyedro’s energy monitoring systems help Canadian Tire Red Deer identify waste and save money!
Eyedro real-time electricity monitoring helps you reduce your electric bill.
Track your home’s energy footprint with an Eyedro real-time power usage monitor. Saving electricity has never been easier.
There are multiple reasons to monitor your electricity usage with an Eyedro home energy monitor including identifying your usage patterns and energy hogs, as well as understanding the power draw of your appliances so you can change your habits and save money!

Clark Griswold would be shocked by the difference in his electricity bill if he lit his yard with 25000 modern energy efficient LED Christmas lights.
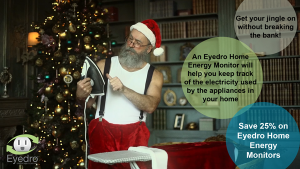
Take charge of your electric bills with an Eyedro Home Energy monitor and save energy at home!
With Eyedro you can track your daily phantom power usage. Phantom power is the energy used by your household devices even when you have turned them off. Small “energy vampires” like the clock on your microwave oven or your phone charger power adapter use tiny amounts of “phantom power” that, as a group, can account for 10% of your annual electricity consumption!
Switching from incandescent to LED lighting in your home or business can help you meet your energy reduction goals. Your Eyedro Electricity Monitor will display your reduced energy consumption immediately in real-time!
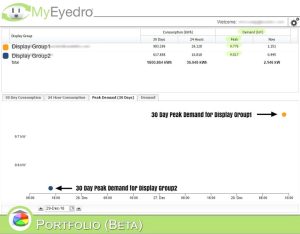
New MyEyedro electricity monitoring platform plugin allows you to determine 30 day and instantaneous peak electricity demand.
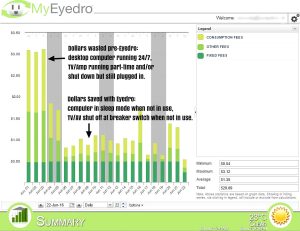
Tips to Prepare Your Home to Save on Utility Bills This Summer – you may already be conserving electricity. Turning off lights in empty rooms, switching to LED lighting, and putting your computer in sleep mode when you leave your desk are common examples. Conserving electricity can be taken further.