Usage Ranking
See which systems, assets, or locations consume the most energy—so you can target the biggest cost drivers first.
Renewable Generation Metrics & Ranking
Track solar or generation performance and compare outputs to maximize ROI and system efficiency.
Asset Metrics & Asset Ranking
Analyze individual equipment performance and rank assets by consumption or efficiency to identify underperforming equipment.
Events & Alerts Reporting
Log and review system events and alerts to detect issues early and reduce downtime.
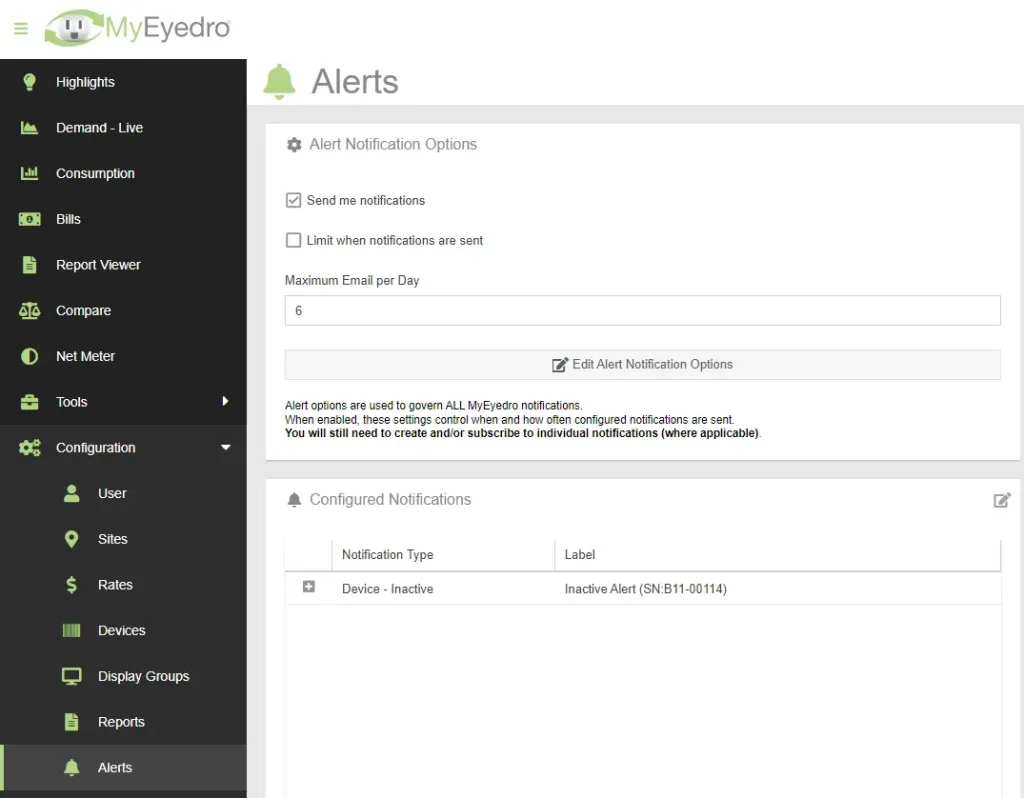
Consumption Threshold Alerts
Get notified when energy usage exceeds defined limits—so you can catch spikes and control costs immediately.
Demand Threshold Alerts (Instantaneous)
Detect sudden power surges in real time to prevent overloads and avoid costly demand charges.
Demand Threshold Alerts (Continuous)
Monitor sustained high usage over time to identify inefficiencies and reduce long-term waste.
Demand Threshold Alerts (Average)
Track average demand levels to optimize energy usage patterns and improve planning.
Up to 24 Months of Historical Data
Export long-term electricity, water, gas, and temperature data to analyze trends and seasonality.
Full-Year High-Resolution Data (Down to 15-Minute Intervals)
Access detailed datasets for up to 365 days to identify patterns, inefficiencies, and anomalies.
Extended Minute-Level Data (Up to 92 Days)
Drill into granular performance data to debug issues and validate system behavior.
Raw Data Access (W, A, Pulse Counts)
Export raw measurements for advanced analysis, integrations, and custom reporting.

A wide range of Standard features included at no cost.
Upgrade with a Professional device license.
| Features |
Standard Device License
Included
|
Professional Device License |
|---|---|---|
| Plugins | ||
| iHighlights | ||
| iDemand | ||
| iConsumption | ||
| iBills | ||
| iReports Viewer | ||
| iNet Meter | ||
| iCompare | ||
| iUtility Dashboard | ||
| iDelta T | ||
| iAsset Intelligence | ||
| iAsset Dashboard | ||
| Tools | ||
| iData Exporter | ||
| iDevice Meter | 1 | |
| iBase Load | ||
| iPeak Load | ||
| iCost Estimator | ||
| iUnit Converter | ||
| iSolar Calculator | ||
| Configuration | ||
| iUser Preferences | ||
| iSites | ||
| iRates | ||
| iDevices | ||
| iDisplay Groups | ||
| iReports | ||
| iAlerts | ||
| iLicenses | ||
| iAssets | ||
| Reports | ||
| iUsage and Cost with Graph | ||
| iUsage and Cost | ||
| iNet Meter | ||
| iUsage Ranking | ||
| iRenewable Generation Metrics | ||
| iRenewable Generation Ranking | ||
| iAsset Metrics | ||
| iAsset Ranking | ||
| iEvents & Alerts | ||
| iDevice Uptime | ||
| iDevice Settings | ||
| Alerts | ||
| iDevice Inactive | ||
| iDevice Active | ||
| iConsumption Thresholds | ||
| iDemand Thresholds - Instantaneous | ||
| iDemand Thresholds - Continuous | ||
| iDemand Thresholds - Average | ||
| Data Sharing | ||
| iSite Data Sharing | ||
| iDisplay Group Data Sharing | ||
| Support | ||
| Self Help | ||
| Phone | 2 | |
| Data Resolution |
Standard Device License
Included
|
Professional Device License |
|---|---|---|
| Data Retention and Access | ||
| Monthly | 2 years | 5 years |
| Weekly | 2 years | 5 years |
| Daily | 2 years | 5 years |
| Hourly | 1 year | 3 years |
| 30 Minute | 1 year | 3 years |
| 15 Minute | 1 year | 3 years |
| 5 Minute | 60 days | 1 year |
| 1 Minute | 60 days | 1 year |
| Raw | 60 days | 1 year |
| Measurement |
Standard Device License
Included
|
Professional Device License |
|---|---|---|
| Energy - Watt-hours | ||
| Monthly (Wh) | 12 months | 24 months |
| Weekly (Wh) | 26 weeks | 52 weeks |
| Daily (Wh) | 92 days | 365 days |
| Hourly (Wh) | 31 days | 365 days |
| 15 Minute (Wh) | 7 days | 365 days |
| 5 Minute (Wh) | 1 day | 92 days |
| 1 Minute (Wh) | 1 day | 92 days |
| Electricity - Watts | ||
| 15 Minute (Avg W) | 1 day | 92 days |
| 5 Minute (Avg W) | 1 day | 92 days |
| 1 Minute (Avg W) | 1 day | 92 days |
| Raw (W) | 1 day | 7 days |
| Electricity - Amperage | ||
| 15 Minute (A) | - | 92 days |
| 5 Minute (A) | - | 92 days |
| 1 Minute (A) | - | 92 days |
| Raw (A) | - | 7 days |
| Electricity - Voltage | ||
| 15 Minute (V) | - | 92 days |
| 5 Minute (V) | - | 92 days |
| 1 Minute (V) | - | 92 days |
| Raw (V) | - | 7 days |
| Electricity - Power Factor | ||
| Raw (PF) | - | 7 days |
| Diagnostic (Wh/W/A/V/VA/VAR/PF) | ||
| 1 Hour Diagnostic | - | 30 days |
| 15 Minute Diagnostic | - | 14 days |
| 5 Minute Diagnostic | - | 14 days |
| Diagnostic (W/A/V/VA/VAR/PF) | ||
| 1 Hour Diagnostic | - | 30 days |
| 15 Minute Diagnostic | - | 14 days |
| 5 Minute Diagnostic | - | 14 days |
| Water & Gas Volume | ||
| Monthly Volume | 12 months | 24 months |
| Weekly Volume | 26 weeks | 14 days |
| Daily Volume | 92 days | 365 days |
| Hourly Volume | 31 days | 365 days |
| 15 Minute Volume | 7 days | 365 days |
| 5 Minute Volume | 1 day | 92 days |
| 1 Minute Volume | 1 day | 7 days |
| Water & Gas Pulse Count | ||
| 15 Minute Pulse Count | 1 day | 92 days |
| 5 Minute Pulse Count | 1 day | 92 days |
| 1 Minute Pulse Count | 1 day | 92 days |
| Raw Pulse Counts | 1 day | 7 days |
| Temperature (°K,°F,°C) | ||
| Hourly Avg. | 31 days | 365 days |
| 15 Minute Avg. | 7 days | 365 days |
| 5 Minute Avg. | 1 day | 92 days |
| 1 Minute Avg. | 1 day | 7 days |
| Raw | 1 day | 7 days |
Custom-built cloud monitoring for complex organizations
Logos, colors, and private-label domain experiences.
Full API access and Cloud-to-Cloud integration.
Specialized reports and customized features.
Efficient, high-resolution data streams.
| Product Type | MyEyedro License |
|---|---|
| Environment | Commercial/Industrial, Residential |
| UPC/GTIN12 | 784668445792 |