Health Check
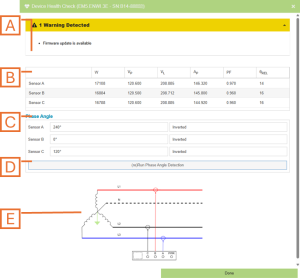
The health check dialog is provided as a means to validate the measurements are as expected and provide a list of warnings and/or errors detected.

The health check dialog is provided as a means to validate the measurements are as expected and provide a list of warnings and/or errors detected.
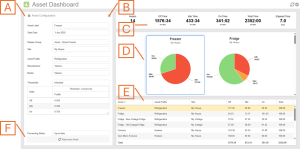
The MyEyedro Asset Dashboard plugin displays run-state analysis for one or more configured assets, in various user configurable, presentation formats. It is assumed that each
Billing Details First Name * Last Name * Company Name (optional) Country / Region *Select a country / region…AfghanistanÅland IslandsAlbaniaAlgeriaAmerican SamoaAndorraAngolaAnguillaAntarcticaAntigua and BarbudaArgentinaArmeniaArubaAustraliaAustriaAzerbaijanBahamasBahrainBangladeshBarbadosBelarusBelauBelgiumBelizeBeninBermudaBhutanBoliviaBonaire, Saint Eustatius and SabaBosnia and HerzegovinaBotswanaBouvet
Remove item Thumbnail image Product Price Quantity Subtotal × EYEDRO-HOME CAD $139.00 EYEDRO-HOME quantity CAD $556.00 × Commercial Energy Meter – EB-EW-E3-200A CAD $719.00 Commercial

Discover how Brick Brewery turned electricity monitoring into a competitive advantage using Eyedro.
Eyedro Green Solutions Inc. Terms of Use Version: 1.5 Posted: 14-Jun-2023 Acceptance of Website Terms For the purposes of these Terms and Conditions, “Eyedro”, “we”, “us”
Eyedro Green Solutions Inc. Privacy Policy Version: 2.0Posted: 2-Oct-2019 Preface Eyedro Green Solutions Inc. is committed to keeping personal information it collects accurate, confidential, secure and
Request a Demo Real-Time Utility Monitoring for Schools Monitor electricity, natural gas, water, compressed air, and temperature from one convenient platform – helping you reduce
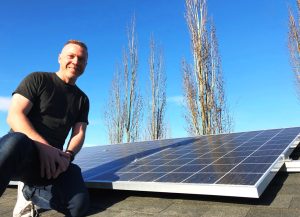
Testimonial on installing and using the Eyedro EYEFI-4 solar and energy monitor.
Navigating the Eyedro Install Tool is simple and intuitive. The below image highlights the key regions of the user interface and how to get around.