How to Use the Highlights Plugin
Purpose:
To explain how to use the Highlights plugin in My.Eyedro.com.
Introduction:
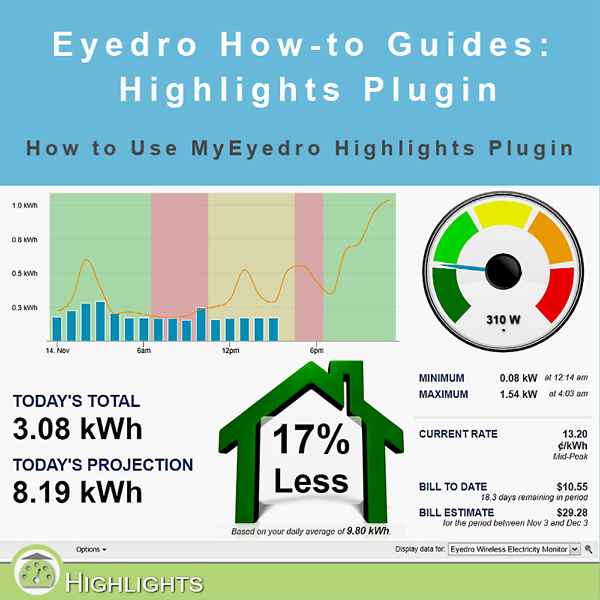
Highlights displays daily average information for a selected display group. If you are viewing it on Wednesday, the average is based on the last 4 Wednesdays plus historical data for that date.
Instructions:
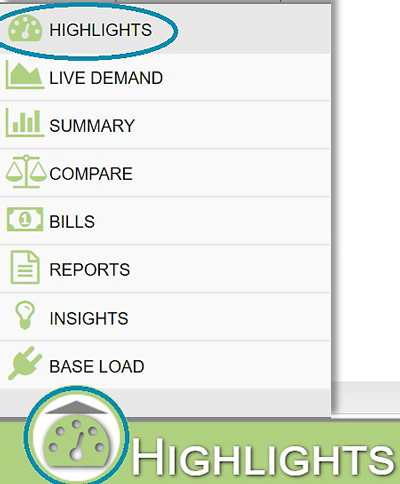
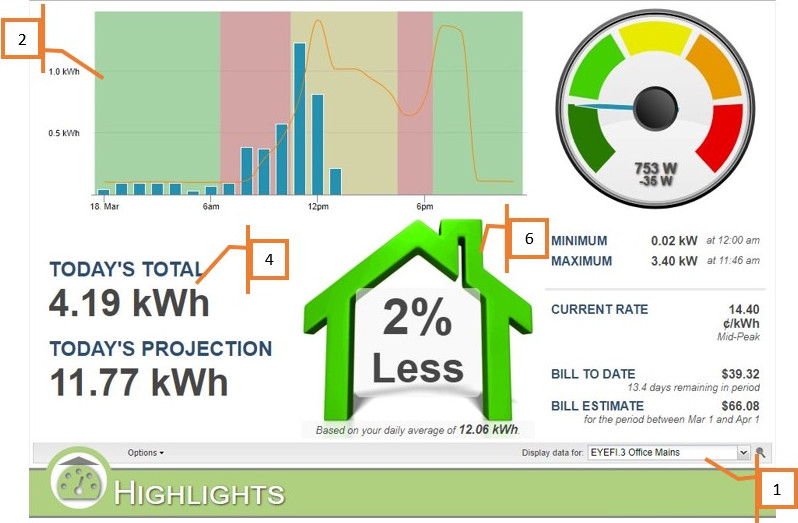
- From the plugin menu (bottom left of page), select Highlights. Pick a display group to display using the dropdown box.
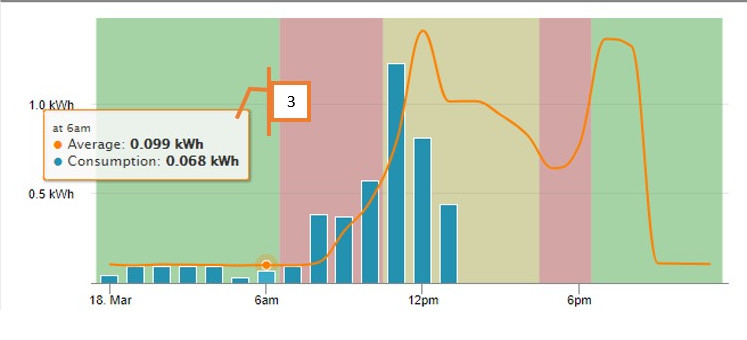
- The graph shows the hourly data for today. The orange line is the daily average.
- Hovering your mouse over the graph displays either the daily average for that hour, or the average and today’s consumption, depending on whether the point is in the past or not. Note that if your rate profile is set to Time-of-Use (TOU) the TOU bands will be displayed.
- Today’s Total displays the amount of kWh consumed today so far, or the total cost for today based on the option set.
- Today’s Projection displays the projected value of either kWh consumed, or cost.
- The building graphic lets you know if you are using more, less or equal to the daily average (expressed as a percentage).
- The dial shows current consumption values, and how close to the daily average Maximum or Minimum you are.
- The current rate shows the cost/kWh you are being charged currently.
- Bill to date and Bill Estimate are calculated values using the amount of kWh used (from our sensors) and your Rate settings.
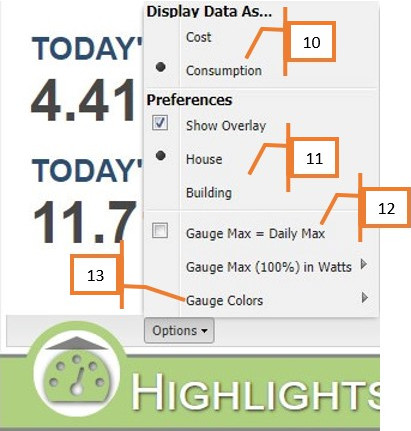
- Use the Options dropdown menu to customize your Highlights view. Change data to display as either Cost or Consumption.
- Display the overlay as either a house (for residential use) or a building (for business/industrial use).
- Set the Gauge Max = to the Daily Max or as a specific percentage.
- Set the Gauge Colors for different percentages based on your personal preference.
For more information:
To contact Eyedro Support:
Via web: Contact Us
