MyEyedro User Guide v4
8.4.Compare-v4
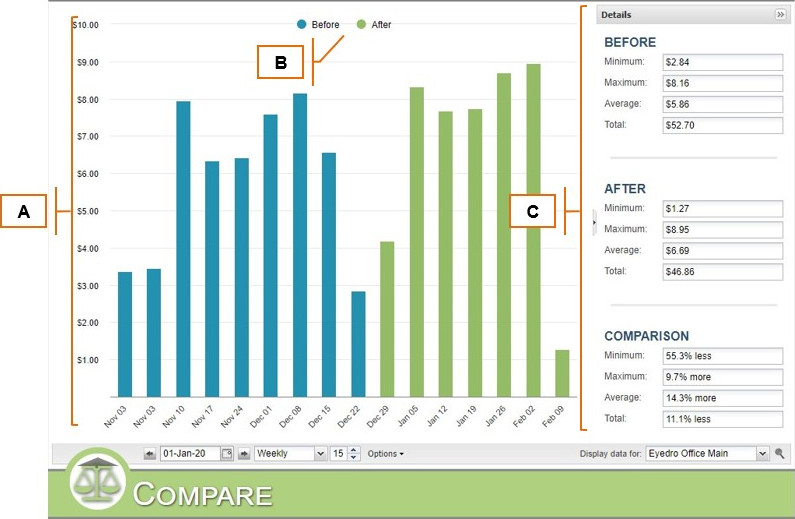
The Compare plugin displays comparisons of daily, weekly, and monthly cost or consumption data for all sensors of a specified Display Group.
| Field | How It’s Used | |
A | Comparison Graph | Displays comparisons of daily, weekly, and monthly cost or consumption data for all sensors of a Display Group. |
B | Comparison Graph Legend | Displays the graph legend and is used to toggle different series on or off in the Comparison Graph. |
C | Details | Displays basic statistics for current graph data and the comparison between the different points of interest. |
0 of 0 users found this section helpful
