MyEyedro User Guide v4

8.2.1.Customizing Live Demand-v4
All plugins on the MyEyedro client can be customized so you see the data you need to. To customize the Live Demand plugin, follow the instructions below.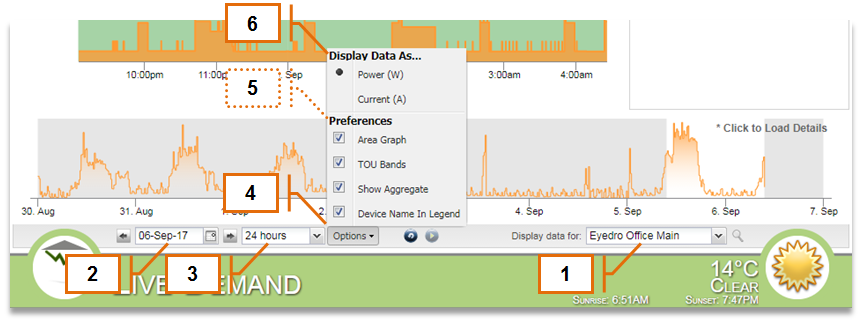
- Specify which Display Group data should be displayed for by selecting the appropriate Display Group from the “Display data for” dropdown menu.
- Choose the date to which electrical consumption or cost data is displayed. Changing this value will adjust the right most date of the Master Timeline Graph. By default this will be set to the current date.
- Choose the scale of the Detailed Timeline Graph. This option will also adjust the size of the selection window in the Master Timeline Graph.
- Click on the Options menu to customize your plugin settings.
- Optionally, specify your graph preferences:
- Area Graph: toggles between area and line graphs.
- TOU Bands: toggles rate plot bands on/off. Plot bands are only applicable when the current Rate Structure in use is Time of Use.
- Show Aggregate: toggles whether display data for all sensors in the selected Display Group are aggregated or displayed individually.
- Device Name in Legend: toggles whether the Device Name is displayed in the Detailed Timeline Graph Legend.
- Specify whether the Live Demand plugin should display Power (W) information or Current (A) information.
0 of 0 users found this section helpful