MyEyedro User Guide v4

8.3.1.Customizing Summary-v4
All plugins on the MyEyedro client can be customized so you see the data you need to. To customize the Summary plugin, follow the instructions below.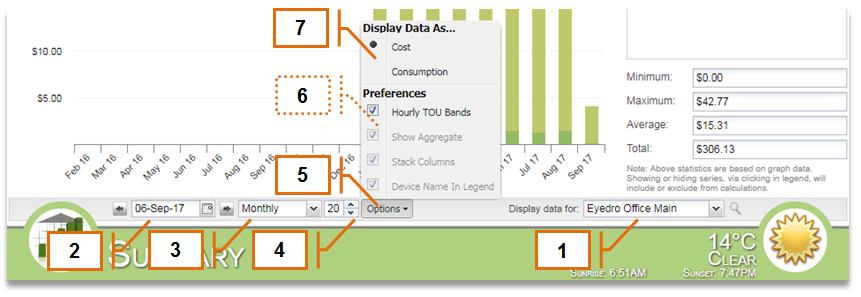
- Specify which Display Group data should be displayed for by selecting the appropriate Display Group from the “Display data for” dropdown menu.
- Choose the date to which electrical consumption or cost data is displayed. By default this will be set to the current date.
- Choose the scale of the Summary Graph. 15-minute, hourly, daily, weekly, and monthly scales are currently supported.
- Choose the number of steps (in the x-axis) are shown in the Summary Graph.
- Click on the Options menu to customize your plugin settings.
- Optionally, specify your graph preferences:
- Hourly TOU Bands: toggles the overlay of Time of Use bands when viewing data in hourly (or less) scale.
- Show Aggregate: toggles whether data for all sensors in the Display Group are aggregated or displayed individually.
- Stack Columns: toggles whether values for each sensor will be stacked on top of each other or displayed side-by-side.
- Device Name in Legend: toggles whether the Device Name is displayed in the Summary Graph Legend.
- Specify whether the Summary plugin should display Cost ($) information or Consumption (kWh) information.
0 of 0 users found this section helpful