MyEyedro User Guide v4
8.3.Summary-v4
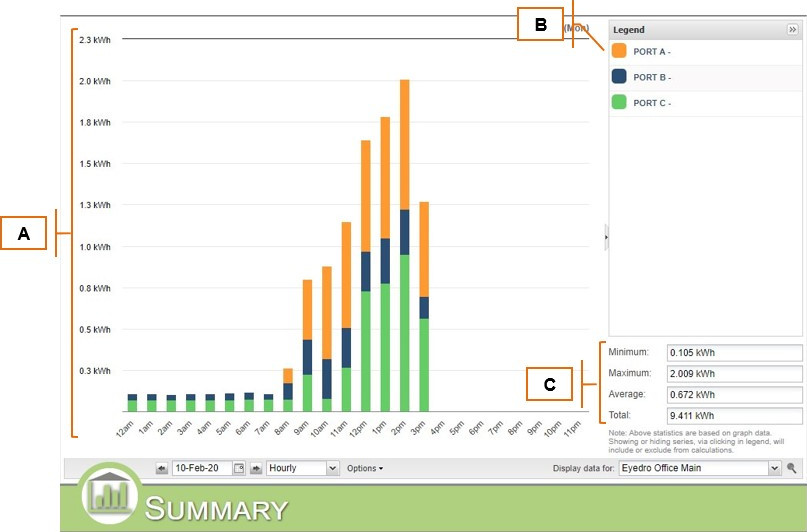
The Summary plugin displays a graph of hourly, daily, weekly, or monthly cost or consumption data for all sensors of a specified Display Group.
| Field | How It’s Used | |
A | Summary Graph | Displays hourly, daily, weekly, or monthly cost or consumption data for all sensors of a specified Display Group. |
B | Summary Graph Legend | Displays the graph legend and is used to toggle different series on or off in the Summary Graph. |
C | Summary Statistics | Displays basic statistics for data currently in the Summary Graph. Calculations are based on which series are included or excluded in the Summary Graph Legend. |
0 of 0 users found this section helpful
