MyEyedro User Guide v4

8.2.Live Demand-v4
The Live Demand plugin displays live summaries of current and historical electrical data for all sensors of a specified Display Group. This plugin only supports real-time data collection.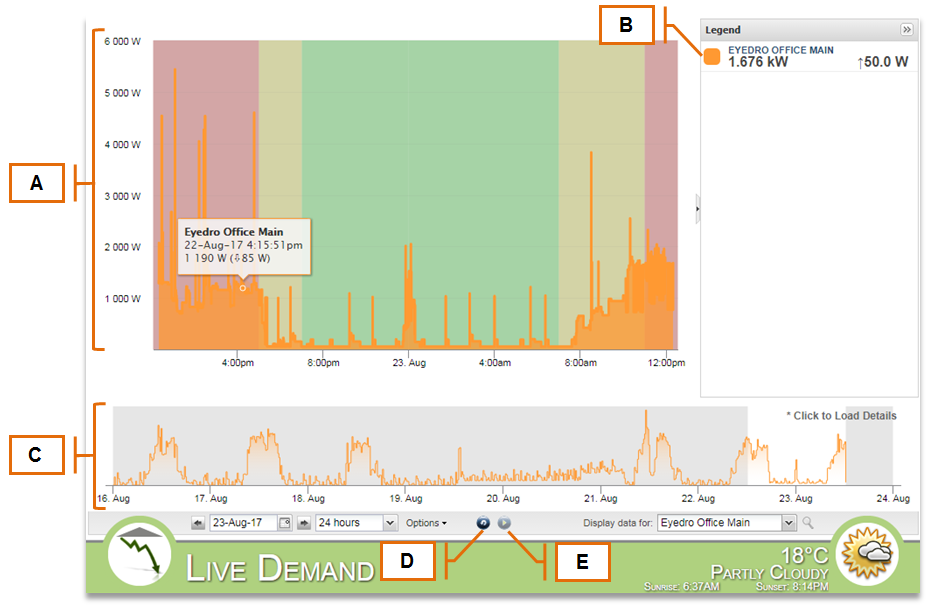
| Field | How It’s Used | |
A | Detailed Timeline Graph | Shows real-time and historical electrical data for all sensors of a selected Display Group. You can use your mouse to highlight regions of the graph to zoom in on. |
B | Detailed Timeline Graph Legend | Displays the graph legend and is used to toggle different series on or off in the Detailed Timeline Graph. Also displays current readings and most recent changes for all sensors on a selected Display Group. |
C | Master Timeline Graph | Shows the aggregate electrical data for the past week. You can use your mouse to click on an area in the timeline to display details for. |
D | Refresh Button | Clicking the “Refresh” button refreshes the plugin, recapturing the data and re-displaying them. |
E | Resume Updates Button | If currently viewing historical data, clicking the “Resume Updates” button will return the selection window to the current time and day, and resume live updates. |
0 of 0 users found this section helpful