MyEyedro User Guide v4
8.7.Insights-v4
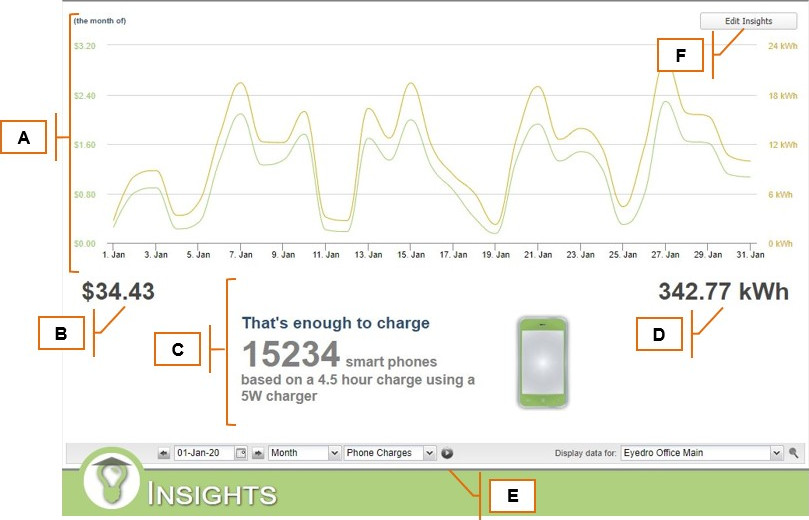
The Insights plugin displays trends and interesting insights based on the electrical consumption and associated costs for all sensors of a specified Display Group.
| Field | How It’s Used | |
A | Trends Summary Graph | Displays trends for electrical cost and consumption for the selected period. |
B | Total Cost | Summation of the cost for the selected period. |
C | Equivalents | Displays the equivalent amount of electricity in various units. |
D | Total Consumption | Summation of the consumption for the selected period. |
E | Play/Pause | Choose to play or pause the Equivalents animation. When animating, will scroll through the equivalent options at a fixed interval. |
F | Edit Insights | Click the “Edit Insights” button to customize Equivalents that are displayed. |
0 of 0 users found this section helpful
