Net Meter | MyEyedro User Guide
The MyEyedro Net Meter plugin displays at-a-glance summaries of net electrical generation and consumption for specified Display Groups. This plugin requires multiple Display Groups. The Net Meter view provides:
- Holistic Energy Visualization: Master your energy ecosystem with a high-impact Net Graph that color-codes solar or wind generation, consumption, and net usage for an instant picture of your efficiency.
- Precision Net Analytics: Dive into the details with an interactive Net Pie Chart and hourly hover-states that reveal exactly how much energy you’re producing versus what you’re drawing from the grid.
- Live Generation & Demand Tracking: Monitor your sustainability in real-time with dual Statistics Dashboards that display both your instantaneous power production and your current electrical demand.

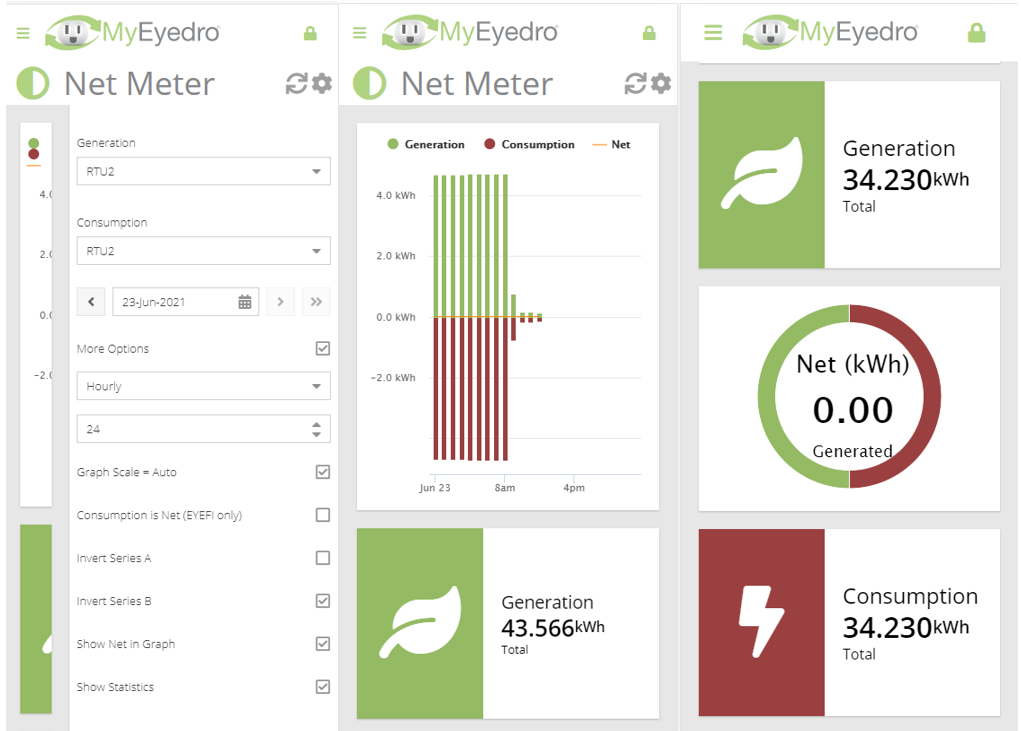
- Net Graph. Displays hourly summary of electrical generation (in green), consumption (in red), and net (in orange).
- Net Graph Details. Hover over any of the columns to see an details for generation, consumption and net for the hour.
- Generation Statistics. Displays total generation (in kWh) and current instantaneous generation reading (in kW).
- Net Pie Chart. Difference between total generation and consumption.
- Consumption Statistics. Displays total consumption (in kWh) and current instantaneous demand reading (in kW).
Net Meter Plugin Tools and Options

- Plugin Tools:
- Refresh. Update the data and visuals on screen.
- Options. Expand or collapse the options menu.
- Select which Display Group to use for the Generation series (green). NOTE: Only display groups comprised of electricity monitoring devices are available in this plugin.
- Select which Display Group to use for the Consumption series (red). NOTE: Only display groups comprised of electricity monitoring devices are available in this plugin.
- Choose the date for which net meter data is displayed. By default this will be set to the current date.
- Check the More Options checkbox to show additional options.
- Choose the Scale used for the data. This can be; hourly, daily, weekly or monthly.
- Choose the Number of Steps (in the x-axis) shown in the Net Graph.
- Graph Scale. Unchecking will allow the user to enter Graph Min, and Graph Max values.
- Invert the polarity of the generation data if required.
- Invert the polarity of the consumption data if required.
- Indicate whether the display group selected for consumption already represents net.
- Show/hide the net series (orange line) in the Net Graph.
- Show/hide statistic data beneath the graph.
Important Notes Regarding Net Meter Plugin Configuration
There are many ways that generation can be tied into the buildings electrical system. When configuring the options for the Net Meter plugin, you want to ensure the following:
- Generation data series should be configured as positive. Use the Invert Generation option to set data polarity. If when viewing the generation series display group by itself (i.e. in the Consumption plugin), the data is represented by negative values, this option should be checked. Otherwise, ensure the option is unchecked.
- It is assumed that the generation data series is installed in a location where only generated data is measured. The sensors should be installed at the output of the AC Inverter where it ties into the transfer switch or the distribution panel.
- Consumption data series should be configured as negative. Use the Invert Consumption option to set data polarity. If when viewing the consumption series display group by itself (i.e. in the Consumption plugin), the data is represented by positive values, this option should be checked. Otherwise, ensure the option is unchecked.
- Consumption data series may already represent the net result. If the selected consumption display group sensors are installed in a location in the electrical panel where both consumption and generation is observed. This scenario is common in an installation where the sensors have been installed at the service entrance conductors and the solar generation inverter output is tied into a breaker in the panel or a downstream sub-panel. Use the Consumption is Net option accordingly.
Mobile View