
Usage and Cost with Graph | MyEyedro User Guide
The Usage and Cost with Graph report type breaks down the usage and cost statistics for a single Display Group while providing a helpful graph for at a glance information.
Report profiles can be created and modified in the MyEyedro Report Configuration plugin and all generated reports can be viewed in the MyEyedro Report Viewer plugin.
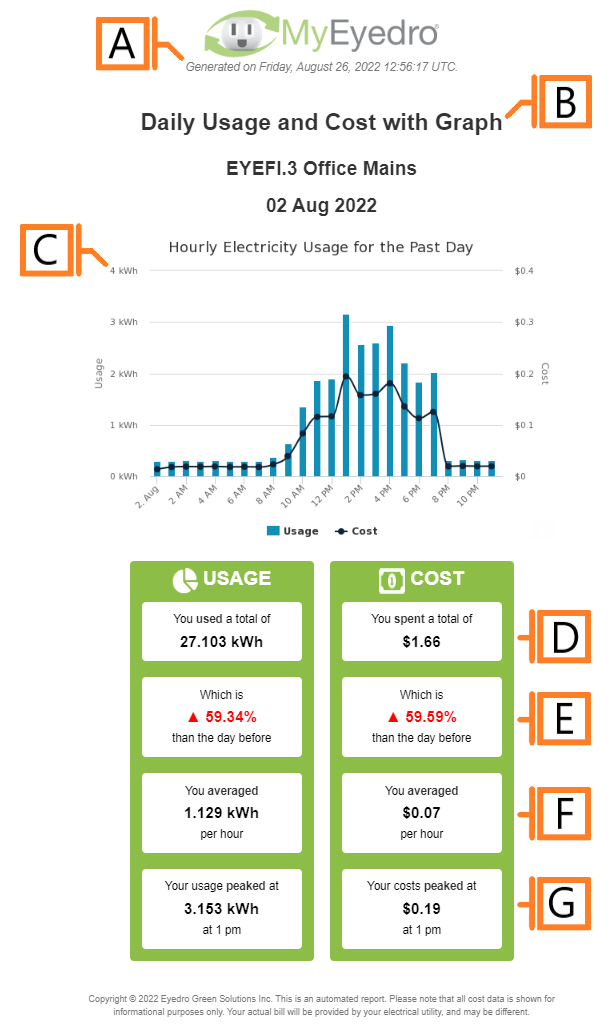
- Generation Date. The date and time the report was generated.
- Report Title. This is a combination of the report title text, display group label and report period as defined in the report configuration options.
- Usage and Cost graph. A graphical representation of the consumption and cost data for the reporting period.
- Total Usage and Cost. Total consumption and cost for the reporting period.
- Comparison. Compares the total consumption and cost to the previous reporting period.
- Average usage and cost.
- Peak usage and cost.
Configuration Options
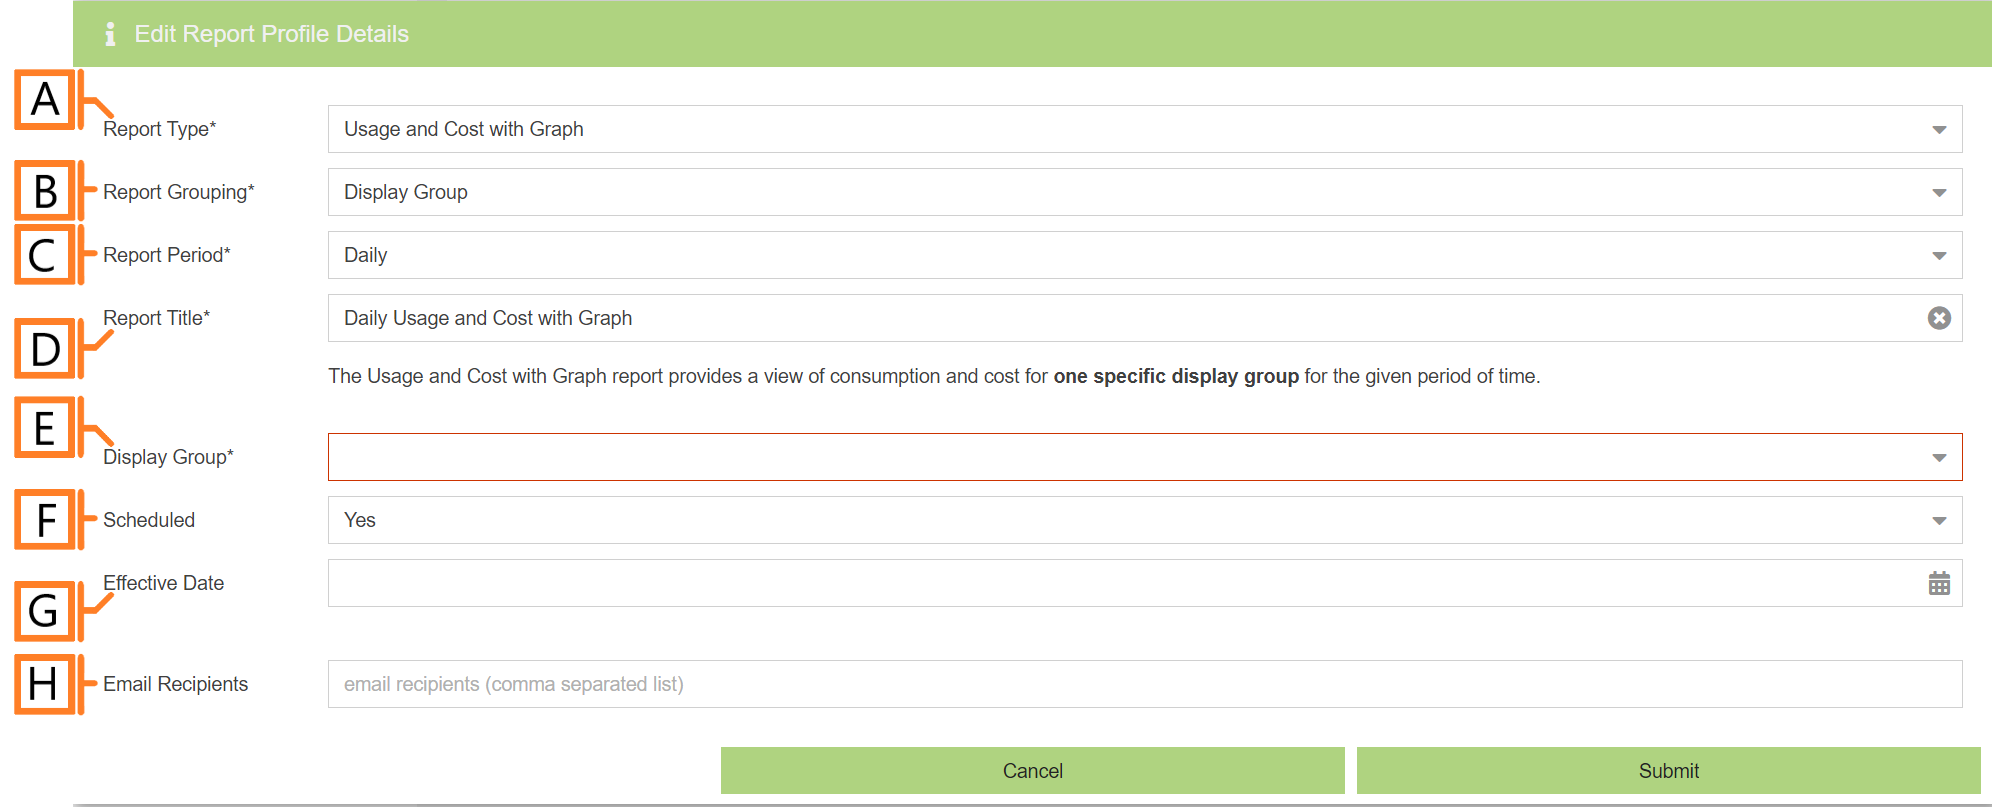
- Report Type. Specify the type of report to generate. Choose Usage and Cost with Graph.
- Report Grouping. Specify whether the report will use Display Groups or Sites as a data source.
- NOTE: Usage and Cost with Graph reports only support Display Groups.
- Report Period. The time frame which the Report will evaluate. Choose one of Daily, Weekly, Monthly, Quarterly or Annually
- Report Title. Used to easily identify what this Report Profile is being used for.
- NOTE: this text will be displayed as the first line of the report title.
- Display Group. The Display Group this profile will report on.
- Scheduled. Automatically generates a report on the scheduled start day and each period there after.
- PRO-TIP: To create Usage and Cost with Graph reports for a dynamic date range (i.e. to create reports matching your utility bill periods), create a report profile with the Scheduled option set to No and use the Report Viewer plugin to create dynamic period reports.
- Effective Date. The first date your report is scheduled to run.
- NOTE: this option is only visible for scheduled reports.
- Email Recipients. The Email addresses you wish a copy of the scheduled report to automatically be sent to.
- NOTE: this option is only visible for scheduled reports.
Example: Creating a daily report
To create a Usage and Cost with Graph report that automatically runs at your desired interval, and optionally arrives in your inbox every morning, follow these steps:
- From MyEyedro, browse to the Reports Configuration plugin
- Click on the Add Report Profile button located below the Report Profile List
- Choose Usage and Cost with Graph from the Report Type field
- Leave the default Sub-Category set to Electricity.
- NOTE: Usage and Cost with Graph reports only support Electricity devices and display groups.
- Leave the default Report Grouping field set to Display Group
- Leave the default Report Profile field set to Daily
- Choose your desired Display Group from the list of available options
- Change the default Report Title as necessary. This value is automatically generated based on the above options but can be changed if desired.
- Set the Scheduled option to Yes
- Set the Effective Date field to tomorrow by clicking on the calendar icon and selecting the desired date. Optionally, this can be set to any day in the past and all historical reports will be generated when the report profile is saved
- Optionally, enter your email address in the Email Recipients field to receive the generated reports by email
- PRO-TIP: If you would like this report emailed to multiple email addresses, enter the list of email addresses separated by commas (,) i.e. “address1@somedomain.com, address2@anotherdomain.com”
- Click on the Submit button to save changes.
- NOTE: If the Effective Date was set in the past, all historical reports will start to be generated in the background. These can be viewed in the Reports Viewer plugin.
- Every day a new report will be generated. This typically occurs around 1am local time
- If you provided one or more email addresses, the reports will arrive in your inbox around 8am local time
Example: Creating a report for a specific period
Step 1 – Create unscheduled report profile
- From MyEyedro, browse to the Reports Configuration plugin
- Click on the Add Report Profile button located below the Report Profile List
- Choose Usage and Cost with Graph from the Report Type field
- Leave the default Sub-Category set to Electricity.
- NOTE: Usage and Cost with Graph reports only support Electricity devices and display groups.
- Leave the default Report Grouping field set to Display Group
- Leave the default Report Period field set to Daily.
- NOTE: Only daily report periods support dynamic range generation. All other options will only generate reports using a single (from) date for the specified period (weekly, monthly, quarterly or annually)
- Choose your desired Display Group from the list of available options
- Change the default Report Title as necessary. This value is automatically generated based on the above options but can be changed if desired.
- Set the Scheduled option to No
- Click on the Submit button to save changes.
Step 2 – Generate dynamic period report(s) via the Report Viewer plugin
- Navigate to the MyEyedro Report Viewer plugin
- Choose the unscheduled report profile that was created in the previous steps from the list of available report profiles
- The details from the report profile will populate in the Report Profile Details panel directly below the report profile list
- Select the desired From date in the Generate Report group by clicking on the calendar icon and selecting the desired date
- Select the desired To date in the Generate Report group by clicking on the calendar icon and selecting the desired date
- Click on the Generate Report button at the bottom of the Report Profile Details panel
- IMPORTANT: Report generation may take several minutes to complete based on the amount of data to be included in the report
- NOTE: Reports with periods up to three days will plot the report graph using hourly data. Reports with periods greater than three days will plot the graph using daily data
- View the report by selecting the newly generated item from the Report Period list. The item in the list will match the from and to dates entered above in the format “DD-Mon-YYYY – DD-Mon-YYYY“
- Optionally, print the report, email it to yourself or others and even download the report data (in csv format) using the toolbar buttons below the report selected for viewing