
Meter
The MyEyedro Meter plugin emulates the functionality of a physical meter providing live readouts and recent historical data for individual sensors of the selected Display Group. It supports electricity data (A, V, PF, kW), temperature data (°C, °F) or volumetric data (flow and pulse count) from various types of Eyedro Monitoring products. The Meter view provides:
- Virtual Precision Metering: Emulate a physical meter on your screen with live, high-fidelity readouts for Electricity (Amps, Volts, Power Factor, and kW), Temperature, and Volumetric data—all from a single interface.
- Dynamic Sensor Intelligence: Gain instant clarity on your equipment’s performance with a Live Statistics Dashboard that tracks current readings, real-time value changes, and historical highs and lows.
The Meter plugin is only available to users with a MyEyedro Business or Professional license.
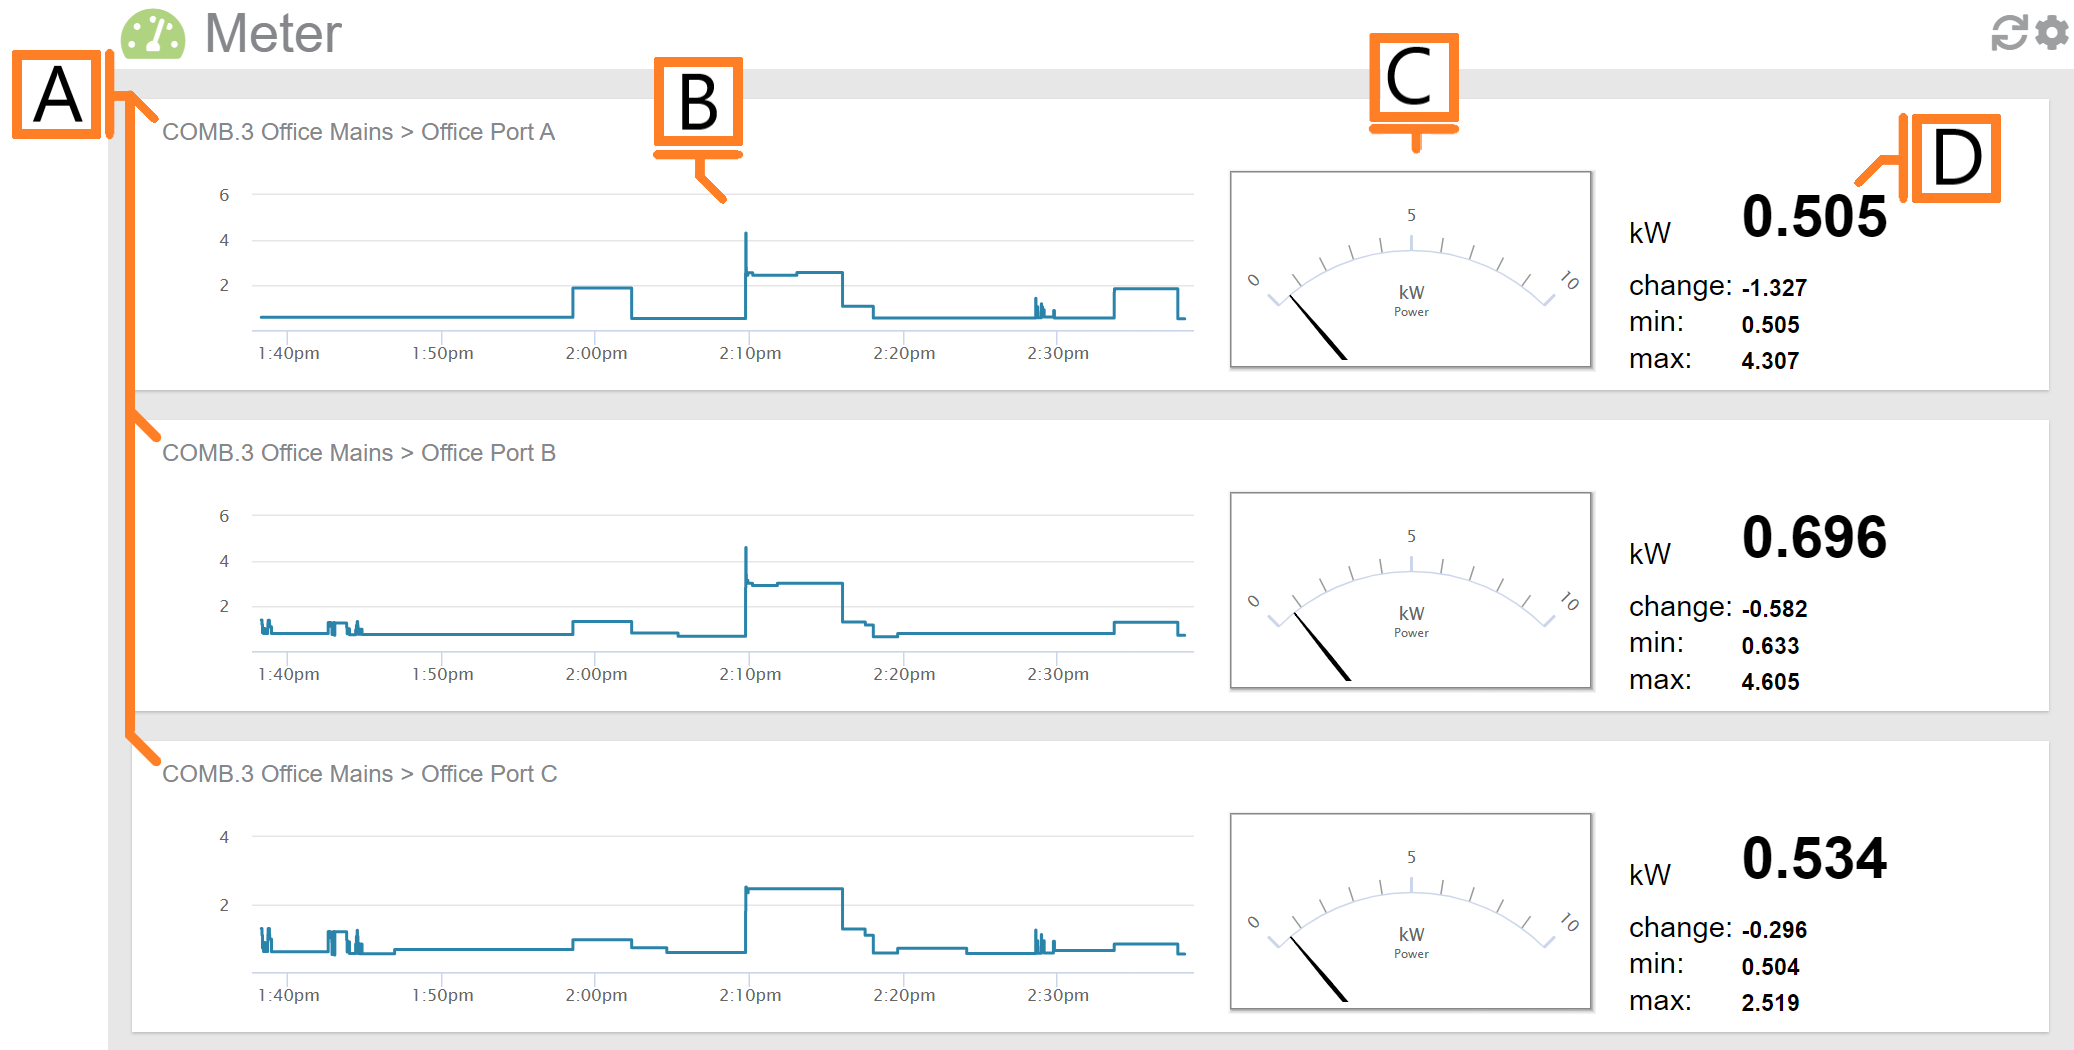
- Sensor Region. There will be one region for each sensor in the selected Display Group.
- Demand Graph. Displays demand measurements for the selected period.
- Demand Gauge. Displays the most recent demand measurement.
- Statistics. Displays the most recent reading, last change as well as minimum and maximum values for the selected period.
Meter Plugin Tools and Options
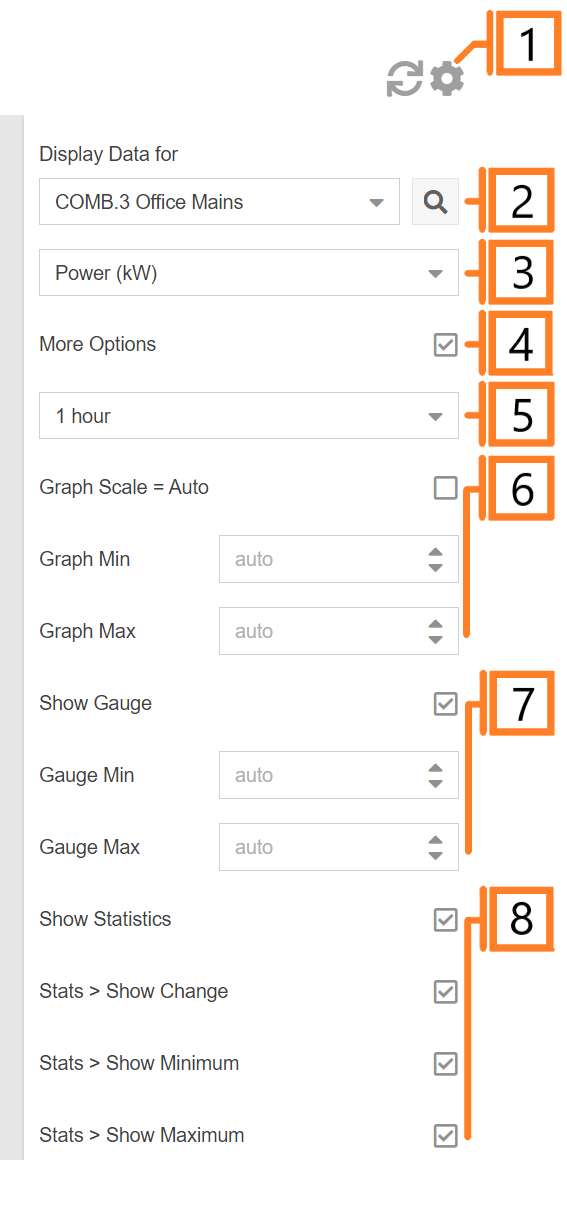
- Plugin Tools:
- Refresh. Update the data and visuals on screen.
- Options. Expand or collapse the options menu.
- Select which Display Group to evaluate.
- Specify Display Units:
- Electricity: Power (kW), Current (A), Voltage (V) or Power Factor (PF).
- Temperature: Celsius (°C), Fahrenheit (°F).
- Volumetric (pulse): Flow (units/min), Pulse Count (pulses).
- Check the More Options checkbox to show additional options.
- Choose the period for the Demand Graph and corresponding Statistics panel.
- Graph Scale: Unchecking will allow the user to enter Graph Min, and Graph Max values.
- Gauge Scale: Unchecking will allow the user to enter Gauge Min, and Gauge Max values.
- Show/hide statistics for all sensors.