
Consumption | MyEyedro User Guide
The MyEyedro Consumption plugin displays a graph of hourly, daily, weekly, or monthly consumption or cost data for all sensors of a specified Display Group. The Consumption view provides:
- Customizable Usage Intervals: Tailor your view with a Consumption Graph that breaks down cost and energy data by the hour, day, week, or month for every sensor in your group.
- Integrated Performance Metrics: Eliminate the guesswork with a Statistics Grid that serves as both a visual legend and a real-time data hub for your graph’s most critical figures.
- Instant Statistical Overviews: Get the “big picture” immediately with Automated Statistics that calculate and display the core metrics of your current data view.
Consumption is a measure of demand over time. For electricity, electrical consumption is measured in kWh and represents the amount of electricity that has been consumed over a period of time. Example: Ten 100W (10 x 0.1kW = 1kW of demand) lamps left on for one hour would equal 1kWh of electricity consumption. For volumetric monitors (water/gas), consumption is measured in units defined based on the type of meter connected to. Example: Water from a bib flowing at a demand rate of 1 gallon/minute left on for 1 hour would equal 60 gallons of water consumption.

- Consumption Graph. Displays hourly, daily, weekly, or monthly consumption or cost data for all sensors of a specified Display Group.
- Statistics Grid. Functions as a graph legend as well as displaying statistics for the contents of the graph.
- Statistics. Displays basic statistics for data currently displayed.
Consumption Plugin Tools and Options

- Plugin Tools:
- Refresh. Update the data and visuals on screen.
- Options. Expand or collapse the options menu.
- Alerts. Expand or collapse the alerts region.
- Select which Display Group to evaluate.
- Select the Date for which consumption data is displayed. By default this will be set to the current date.
- Choose the Data Step Size of the consumption data.
- Choose the Number of Steps (in the x-axis) shown in the Consumption Graph.
- Check the More Options checkbox to show additional options.
- The Display Type specifies whether the graph series displays Consumption or Cost information. NOTE: Display Type is dependent on the type of device(s) in the selected display group.
- Electricity
- Consumption in kilowatt hours (kWh)
- Cost ($)
- Gas or Water
- Volume in units (x) – units specified in display group settings
- Cost ($)
- Temperature
- Temperature (average) in Celsius (°C)
- Temperature (average) in Fahrenheit (°F)
- Electricity
- The Graph Type will change what style of graph is used to display the data.
- Check Aggregate Graph to sum all sensors, of the selected display group, into a single value. Uncheck to display the individual sensors in the graph.
- Specify whether values each sensor will be stacked on top of each other or displayed side-by-side.
- Cumulative Graph
- Unchecked – consumption data will be displayed for each specific point in time based on the chosen data step size (i.e. hourly)
- Checked – consumption data will be displayed as a cumulative graph that adds each new value to the running total of all previous ones, always moving upward or staying flat.
- Graph Scale. Unchecking will allow the user to enter Graph Min, and Graph Max values.
- Check Append Device Label to show device label for each sensor. Uncheck to hide. This option is not available when Aggregate Graph is checked. NOTE: Useful when display groups consist of sensors from multiple devices.
- Check Show Label on Graph to show the display group label in the graph heading. Uncheck to hide. This options is not available when the Aggregate Graph option is unchecked.
- Check Show Date on Graph to show the current date in the graph heading. Uncheck to hide.
- Check Show Graph Legend to display the graph legend. Uncheck to hide.
- Check Show Statistics to display the statistics region of the plugin. Uncheck to hide.
- Check Show Consumption Thresholds to overlay consumption alert threshold settings on the Summary Graph. NOTE: Consumption alerts require a MyEyedro Pro license.
Alerts Tool Panel
Consumption Alert Configurations
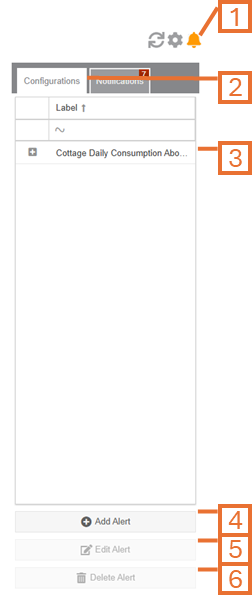
The Alert Configurations Panel, in the Consumption plugin, provides a convenient way to create, edit and delete alert configurations for the selected display group.
IMPORTANT: all devices within the selected display group must have an active MyEyedro Pro license for this functionality to be enabled
- Alerts Tool button. Click this button to show/hide the Alerts panel.
- NOTE: The tool button will flash orange if there are any notifications within the displayed data window.
- Alerts Configuration tab. Click this tab to show any consumption alerts for the selected display group.
- List of existing consumption alerts.
- NOTE: by clicking on the “+” beside the item, a brief description of the alert configuration is displayed.
- Use this button to create new consumption alert configuration for the selected display group.
- Use this button to edit the selected alert configuration.
- Use this button to delete the selected alert configuration.
NOTE: Alert add, edit and delete functionality is described in the Display Group Alerts article.
Consumption Alert Notifications
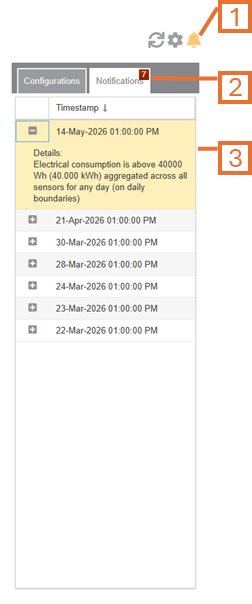
The Alert Notifications Panel, in the Consumption plugin, provides a convenient way to alert notifications for the selected display group.
IMPORTANT: all devices within the selected display group must have an active MyEyedro Pro license for this functionality to be enabled
- Alerts Tool button. Click this button to show/hide the Alerts panel.
- NOTE: The tool button will flash orange if there are any notifications within the displayed data window.
- Alerts Notification tab. Click this to show any notifications that occurred within the window of time displayed in the consumption graph.
- NOTE: A badge containing the number of notifications is displayed on the tab.
- List of existing consumption alert notifications.
- NOTE: by clicking on the “+” beside the item, a brief description of the alert configuration that triggered the notification is displayed.
- NOTE: The selected notification is also displayed with a vertical line overlay on the consumption graph.
Available Alerts
Consumption alerts require a MyEyedro Pro license. NOTE: When creating consumption alerts for a display group, all devices within the display group must have an active MyEyedro Pro license.
Viewing Estimated Cost for a Specific Period
To view cost information for a specific period (i.e. to generate an approximation for your actual utility bill period), use the options as outlined below. Cost information will be displayed using the data collected for the selected Display Group using the Rates and presentation options defined for it.
IMPORTANT: Please note that all cost data is shown for informational purposes only. Your actual bill will be provided by your utility service provider, and may be different.
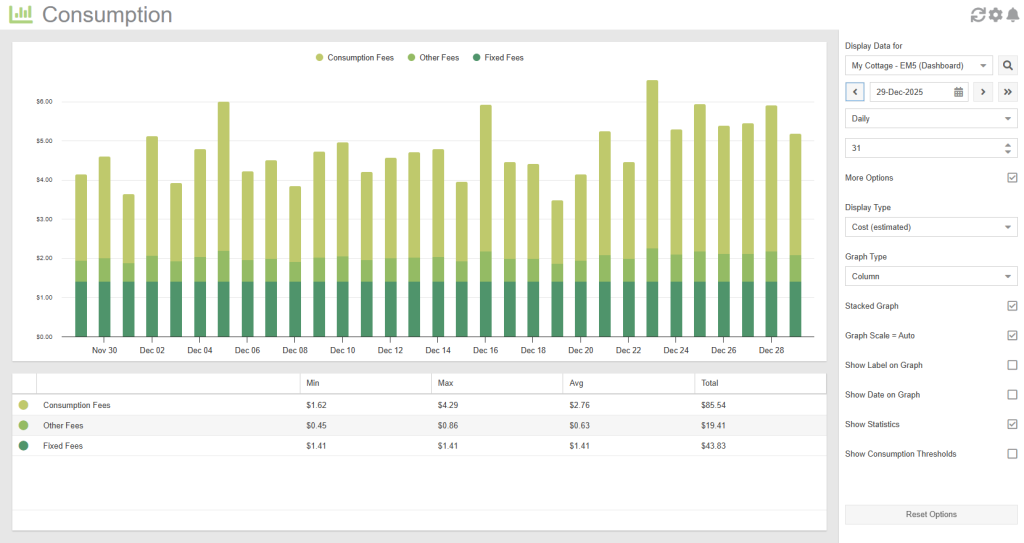
- Select the desired End Date.
- Choose Daily as the data step size.
- Specify the Number of Days to match the desired period.
- Set the Display Type option to Cost (estimated).
- View the estimated costs presented in the graph and statistics regions of the plugin:
- Consumption Fees: Estimated fees computed from the measured consumption using the rate structure (cost per unit of consumption – i.e. $/kWh, $/CCF, etc.) defined in the rate profile.
- Other Fees: Estimated other fees applied based on the rate profile.
- Fixed Fees: Estimated fees that are based on fixed ($/bill) and daily fixed ($/day) fees specified in the rate profile.
PRO-TIP: To see the measured consumption during the same period, change the Display Type option to Consumption (kWh) leaving all other options the same as above.
Mobile View
